

Estimated reading time: 24 minutes
Last updated: August 8, 2026
Introduction
YouTube Studio is the main management area for a YouTube channel. It is where creators manage videos, review comments, change channel settings, check notices, and open YouTube Analytics. YouTube Analytics is the measurement area that helps you understand how viewers discover, choose, watch, and return to your content.
For a faceless channel, Analytics can be especially useful because improvement does not depend on appearing on camera. You can study topics, titles, thumbnails, narration, visuals, editing, audience retention, traffic sources, Shorts performance, and viewer feedback without showing your face.
The goal is not to chase perfect numbers. The goal is to create a repeatable improvement cycle: Publish → Measure → Understand → Improve → Publish Again.
YouTube began gradually rolling out an updated YouTube Studio experience in July 2026, so your Analytics page may look different from older tutorials or screenshots. Focus on the name and purpose of each report rather than memorizing one exact screen position.
This article provides general educational information. It does not guarantee views, subscribers, recommendations, monetization, or business results. YouTube features, metrics, and policies can change, so check current official guidance when a feature changes, when YouTube sends an update notice, and periodically as part of your publishing workflow.
Before Learning
Before opening Analytics, understand a few simple principles.
• YouTube Studio manages the channel; YouTube Analytics measures performance.
• Begin with a question, not with a random number.
• Compare reasonably similar videos, formats, lengths, and time periods.
• Allow data time to develop. Small samples can change quickly.
• One video is not automatically a reliable pattern.
• Analytics shows viewer behaviour, not a viewer’s private thoughts or exact reasons.
• Use comments and human review to add context to performance data.
• Avoid universal benchmark claims such as one perfect CTR or retention percentage.
• Review Shorts separately from long-form videos because the viewing experience and metrics differ.
• Save important performance records so you can compare changes over time.
• Protect private Analytics, revenue, account, and viewer information when sharing screenshots or exports.
A useful beginner rule is: What does this metric measure? What other information do I need? Is this a repeated pattern worth acting on?
What You’ll Learn
• How to open and navigate YouTube Studio.
• How to use the Dashboard without becoming distracted by constant updates.
• How to open channel-level and individual-video Analytics.
• How to understand the Analytics Overview.
• How to interpret views, watch time, average view duration, impressions, and CTR.
• How to read audience-retention patterns.
• How to understand traffic sources and viewer discovery.
• How to use Audience reports, including new, casual, and regular viewers.
• How to compare videos fairly and use Advanced Mode.
• How to review Shorts Analytics separately.
• How to combine comments with performance data.
• How to use Analytics to plan future videos.
• How to build a simple monthly review routine.
• Common mistakes, benefits, limitations, myths, and frequently asked questions.
The core workflow is: Discovery → Choice → Watch → Stay or Leave → Return.
How to Open and Navigate YouTube Studio
Open YouTube Studio on a Computer
1. Sign in to the Google Account connected to your YouTube channel.
2. Open YouTube Studio.
3. Use the left navigation to choose the area you need.
The exact menu can vary by account, permissions, region, feature rollout, and future updates. Common areas include Dashboard, Content, Analytics, Community, Subtitles, Content detection, Earn, Customization, and Audio Library.
• Dashboard: Quick overview of recent channel activity and items that may need attention.
• Content: Manage videos, Shorts, visibility, details, and publishing status.
• Analytics: Review channel and video performance.
• Community: Review and manage comments and community activity.
• Subtitles: Manage captions and subtitle tracks.
• Earn: Review monetization information when available to your channel.
• Customization: Manage channel appearance and basic channel presentation.
• Audio Library: Find YouTube-provided music and sound effects under the current terms shown in Studio.
When you open an individual video from Content, you can also access video-specific details, Analytics, Editor, comments, subtitles, and copyright-related information where available.
For privacy, do not publish screenshots that reveal email addresses, private revenue, client information, private viewer information, or other confidential data.
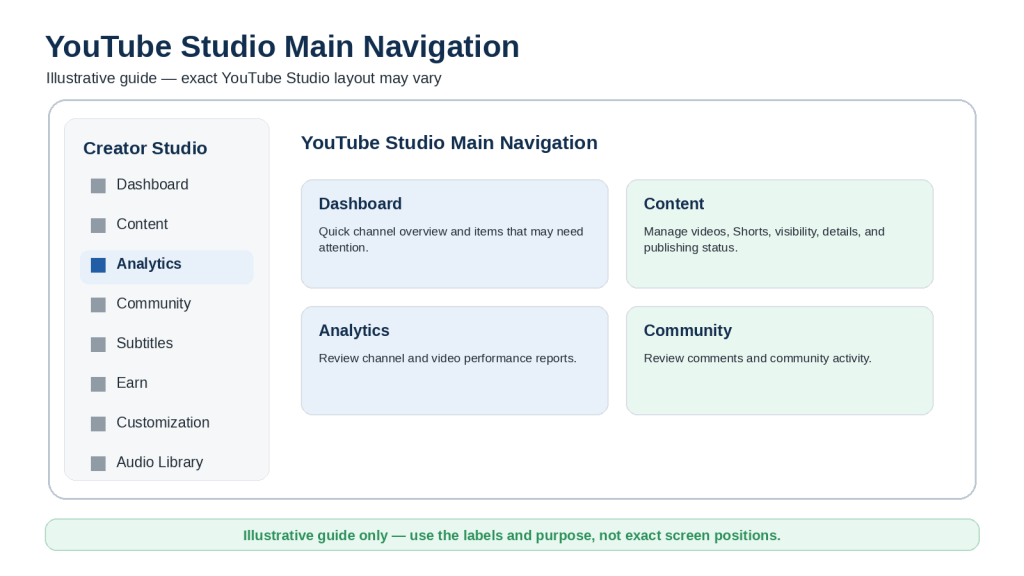
Figure 1. YouTube Studio uses its main navigation to give creators access to areas such as Dashboard, Content, and Analytics.
Explanation: This is an illustrative navigation guide rather than a screenshot. Use it to understand the purpose of the main areas; exact wording and positions may change as YouTube updates Studio.
How to Use the YouTube Studio Dashboard
The Dashboard is useful for a quick channel check. It can surface recent content, channel activity, comments, notices, and other information YouTube wants the creator to see.
Use the Dashboard to answer: What needs attention? Use Analytics to answer: What happened, and what can I learn?
Do not refresh the Dashboard constantly. Early rankings and Realtime movements can change as more viewer activity arrives and YouTube validates data.
A Practical Dashboard Routine
• Check important notices.
• Look for obvious publishing or processing problems.
• Review recent comments that may report errors.
• Notice unusual changes, but investigate them in Analytics before changing strategy.
The Dashboard should help you manage your channel, not make you react emotionally to every movement in a metric.
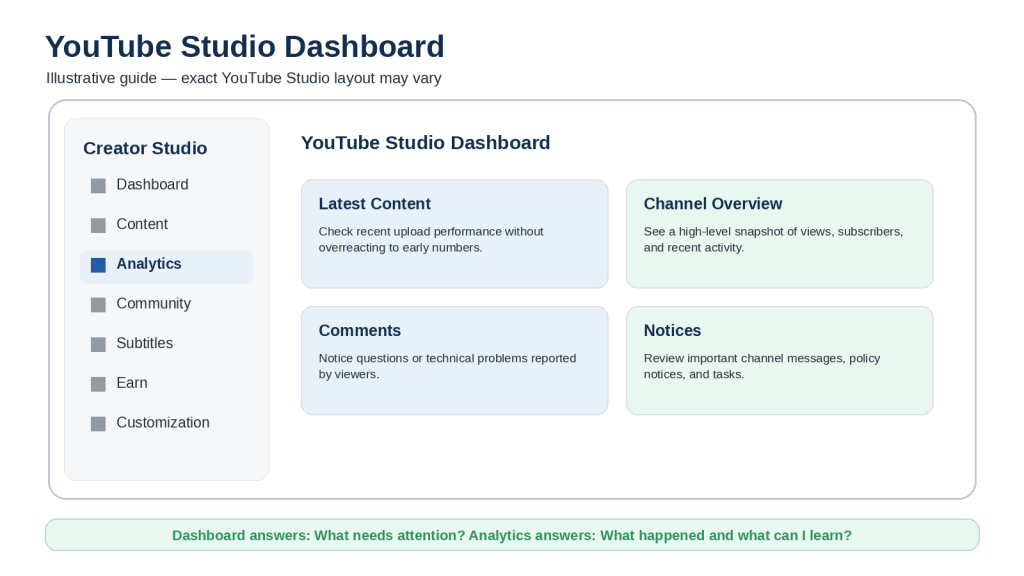
Figure 2. The YouTube Studio Dashboard provides a quick overview of recent channel activity, content performance, notices, and other information that may need attention.
Explanation: Use the Dashboard for a quick check. Open Analytics when you need deeper information about discovery, engagement, audience behaviour, or the performance of one particular video.
How to Open YouTube Analytics for Your Channel and Individual Videos
Channel Analytics
1. Open YouTube Studio.
2. Select Analytics from the left menu.
3. Choose the date range and report that matches your question.
Channel Analytics helps you look for broad patterns across multiple videos, formats, traffic sources, and audience reports.
Individual-Video Analytics
1. Open YouTube Studio.
2. Select Content.
3. Choose the video you want to investigate.
4. Open Analytics for that video.
Use the second path to investigate one particular video.
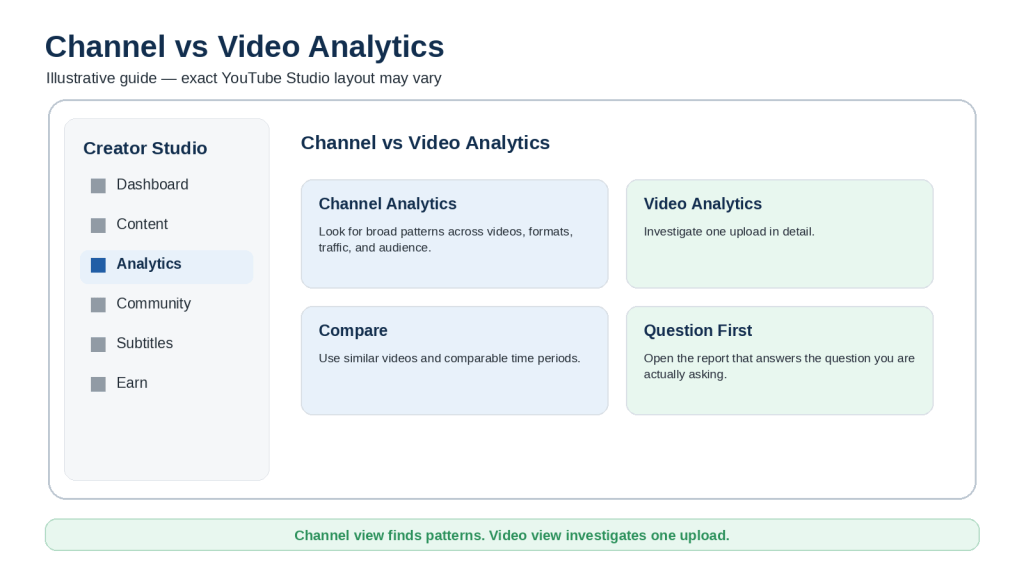
Figure 3. Channel Analytics shows broader performance patterns, while individual-video Analytics helps investigate one specific upload.
Explanation: Use channel Analytics to identify patterns and individual-video Analytics to investigate one upload in more detail. The figure is illustrative; exact Studio layout may vary.
Always check the selected date range. A video can look very different over its first 24 hours, first week, first 28 days, or lifetime. Some reports also contain limited or estimated data, especially when the audience is small.
How to Understand the YouTube Analytics Overview
The Overview tab gives a high-level summary of channel or video performance. Depending on the level and account, it can include views, watch time, subscribers, Realtime activity, typical performance, and other cards.
Use Overview to find the next question. For example, if views changed sharply, ask whether the change came from Search, Browse, Suggested videos, external traffic, Shorts Feed, or another source.
Do not use this workflow: See One Number → Assume the Cause → Change Everything.
Use this instead: See a Number → Ask a Question → Open the Relevant Report → Compare → Review the Video → Decide.
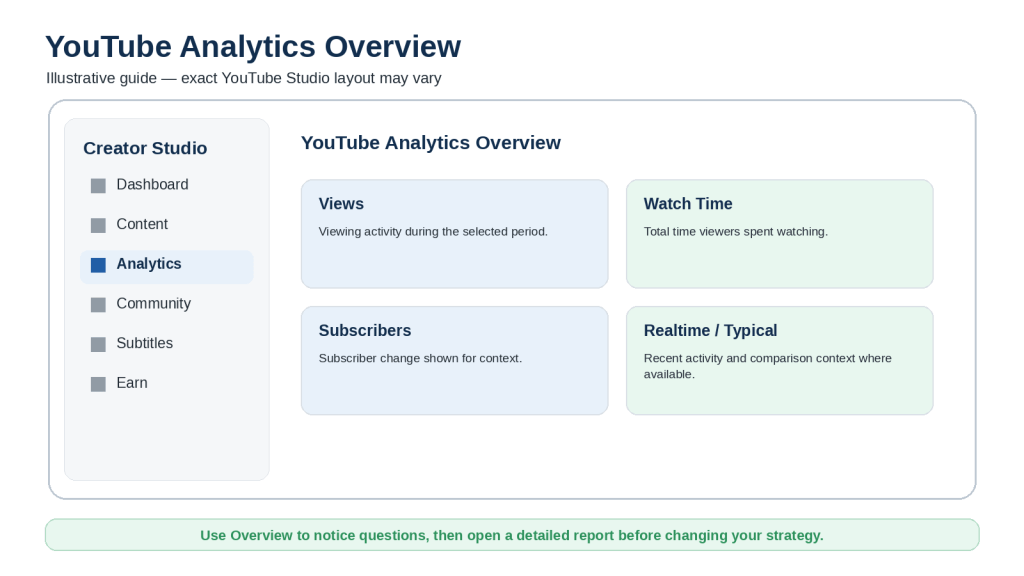
Figure 4. The YouTube Analytics Overview provides a high-level summary that can help creators identify which performance areas deserve closer investigation.
Explanation: Use Overview to notice patterns, then open the detailed report that matches the question. This figure is illustrative rather than a copy of the current YouTube interface.
How to Understand Views, Watch Time, and Average View Duration
Views
Views describe viewing activity. A view is useful, but it does not tell you how long someone watched or how they discovered the video.
Watch Time
Watch time is the total amount of time viewers spent watching. A video can have fewer views but still create more watch time if viewers stay longer.
Average View Duration
Average view duration summarizes the average amount of time watched per view. Video length affects how you interpret it, so compare similar content rather than chasing one universal number.
High CTR with weak viewing can mean the packaging attracted clicks but the video did not meet viewer expectations. Strong average viewing with limited impressions can lead to a different question about discovery.
Before making a decision, ask: What other metric do I need before I decide why this happened?
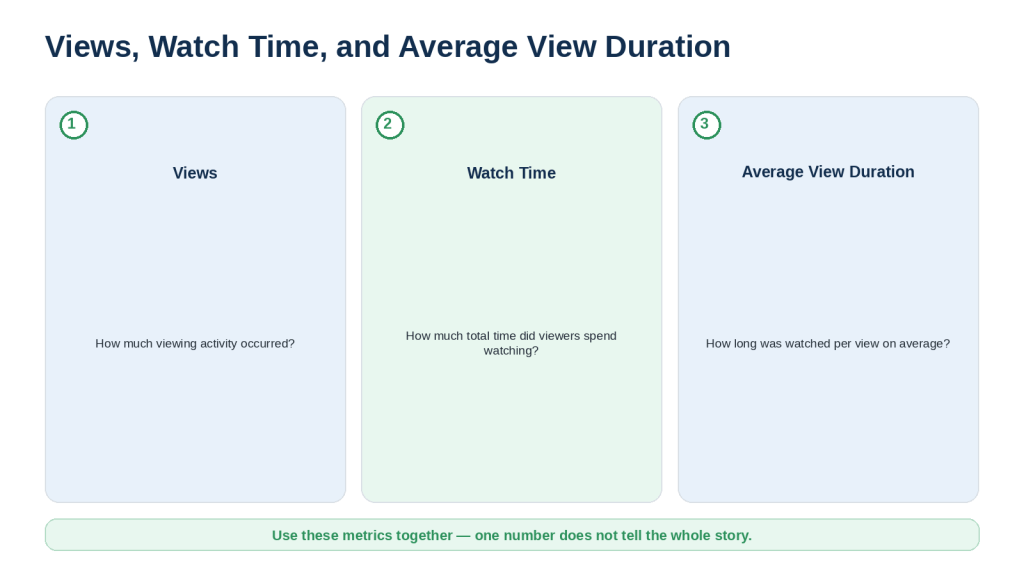
Figure 5. Views, watch time, and average view duration describe different parts of viewer behaviour and are more useful when interpreted together.
Explanation: Views measure viewing activity, watch time measures total viewing time, and average view duration summarizes how long viewers watched per view. Compare them with similar videos and use retention for deeper investigation.
How to Understand Impressions and Impressions Click-Through Rate
An impression is an eligible occasion when YouTube shows a registered thumbnail on a surface that counts toward the impressions metric. Not every view comes from a counted impression.
Impressions click-through rate, or CTR, measures how often viewers watched after seeing a registered impression. YouTube notes that CTR varies by content, audience, and where the impression was shown. There is no single CTR target that guarantees success.
A video can receive more impressions and views while CTR falls because the thumbnail is being shown to a broader audience. That is why CTR should be read together with impression volume, views, watch time, retention, and traffic sources.
Think of the viewer journey as: Shown → Chosen → Watched.
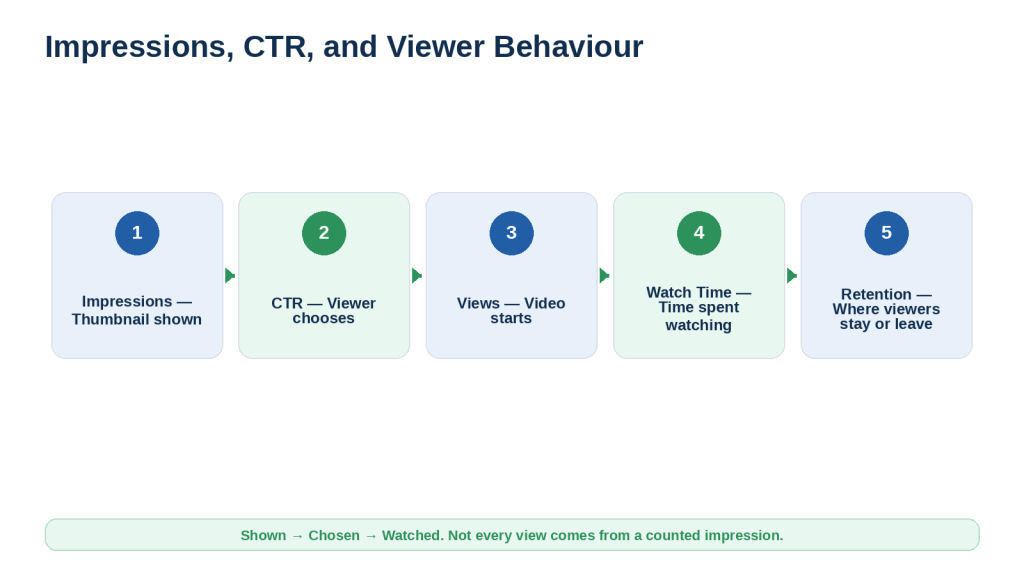
Figure 6. Impressions describe opportunities to see a thumbnail, click-through rate describes the decision to watch, and engagement metrics help explain what happened after the click.
Explanation: Interpret impressions and CTR together with views, watch time, and retention. A high CTR alone does not guarantee strong viewing or future recommendations.
Record important title or thumbnail changes with the date. Otherwise, later Analytics may be difficult to interpret because you may forget what changed.
How to Understand Audience Retention
Audience retention helps you see where viewers continue watching, gradually leave, replay a section, skip ahead, or stop watching. YouTube provides the report at individual-video level, and retention data can take time to process.
Common Retention Patterns
• A relatively flat section can mean viewers continued watching at a steady rate.
• A gradual decline is normal in many videos as some viewers leave over time.
• A spike can appear when viewers rewatch or share a section, but it is not automatically proof that the section was excellent.
• A dip can appear when viewers skip or leave, but you still need to inspect what happened in the video.
• The intro report can help you study the beginning of a video, including the first 30 seconds when the report is available.
Do not use: See a Dip → Panic → Rebuild the Entire Channel.
Use: Find Change → Watch Part → Ask Why → Choose Improvement → Test Again.
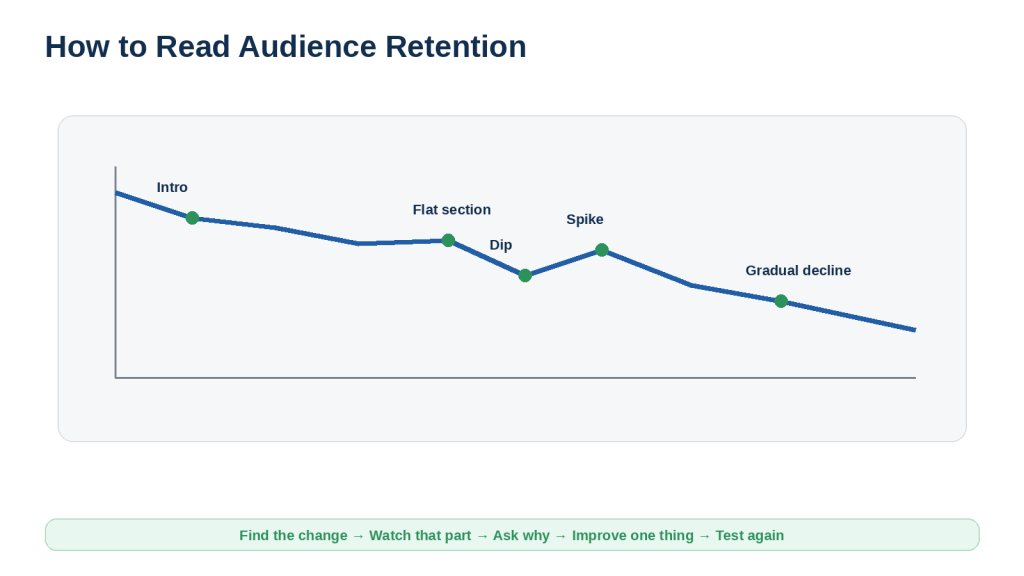
Figure 7. Audience-retention patterns can help identify where viewers continue watching, gradually leave, replay content, skip ahead, or stop watching.
Explanation: A retention graph shows where viewer behaviour changed, not the exact reason. Review the corresponding section, comments, visuals, narration, and pacing before deciding what to improve.
How to Understand Traffic Sources and How Viewers Find Your Videos
Traffic-source reports help explain how viewers discovered your content. Common sources can include YouTube Search, Browse features, Suggested videos, channel pages, playlists, end screens, cards, notifications, external sources, direct or unknown traffic, and the Shorts Feed.
Search traffic can reveal search terms when enough reportable data is available. External reports may identify websites or apps, but low-volume details can be limited for privacy and reporting reasons.
Do not assume that every detailed row must add exactly to the headline total. YouTube can limit low-volume detailed information even while the activity contributes to broader totals.
Traffic-source reports are most valuable when they help you understand the complete viewer journey.
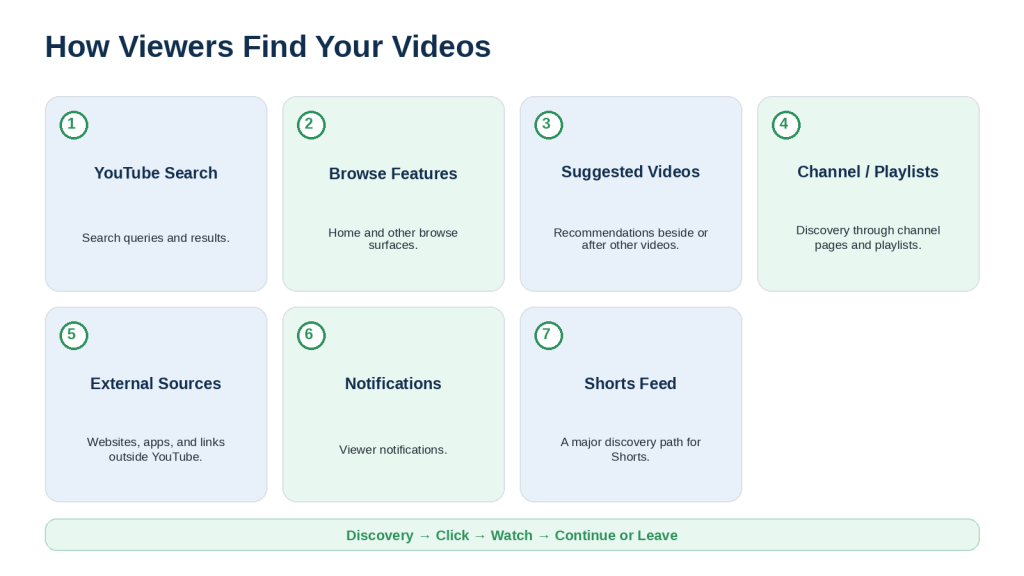
Figure 8. YouTube viewers can discover videos through several sources, including Search, Browse features, Suggested videos, channel pages, playlists, external websites, and notifications.
Explanation: Combine traffic sources with CTR, watch time, and retention to understand what happened after discovery. Shorts can have a different discovery pattern through the Shorts Feed.
Do not buy views or traffic. Artificial engagement can create misleading data and can create separate policy problems.
How to Understand the Audience Tab and Your Viewers
The Audience tab helps you understand who is actively watching. YouTube currently defines monthly audience as the total unique viewers who watched your content during the previous 28 days. It is recalculated daily as a rolling 28-day measure.
New, Casual, and Regular Viewers
• New viewers watched your content for the first time in the selected period.
• Casual viewers watched your channel at least once per month for one to five months in the past year.
• Regular viewers watched at least once per month for more than six months in the past year.
YouTube states that these audience segments do not directly affect reach or monetization. A low regular-viewer percentage can be normal, especially for newer channels, trending content, and channels that mainly publish Shorts.
Other Audience reports can include when viewers are on YouTube, device type, age, gender, geography, subtitle languages, watch time from subscribers, what your audience watches, channels your audience watches, and formats your viewers watch. Some information can be limited when reporting thresholds are not met.
Use Audience information together with Traffic Sources + Retention + Comments + Topic Performance.
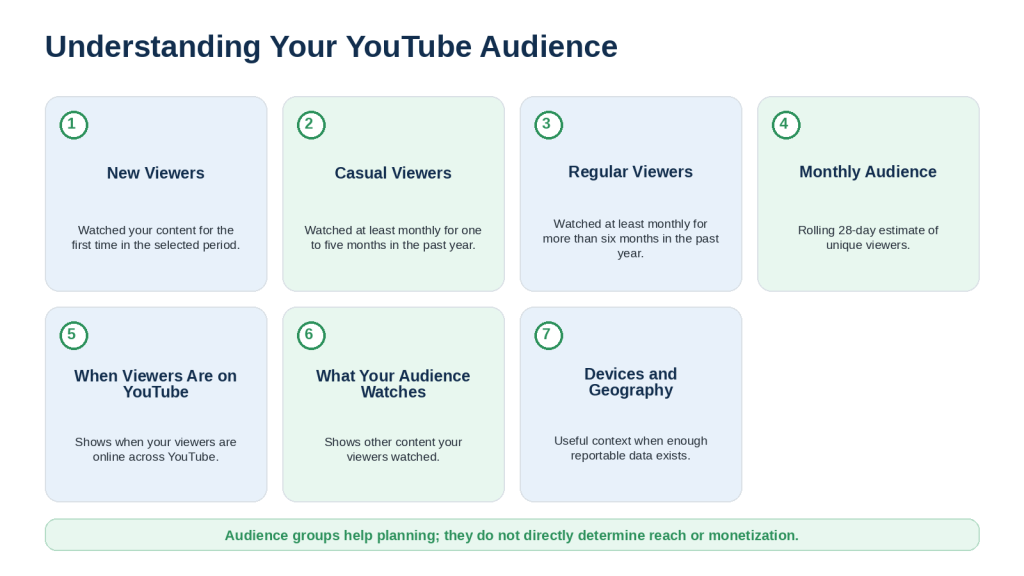
Figure 9. YouTube’s Audience reports can help creators understand new, casual, and regular viewers together with other audience patterns.
Explanation: Audience information can guide planning, but it does not guarantee reach, growth, or monetization. Use it to understand active viewers and repeated interests without stereotyping individuals.
How to Compare Videos and Identify Useful Performance Patterns
Comparisons are most useful when the videos are reasonably similar. Compare the same format, related topics, similar lengths, and comparable time periods whenever possible.
• Compare first 24 hours with first 24 hours.
• Compare first 7 days with first 7 days.
• Compare first 28 days with first 28 days.
• Separate Shorts from long-form unless the question genuinely requires a cross-format comparison.
Advanced Mode can compare videos, groups, playlists, time periods, and metrics. Custom groups can contain up to 500 videos, playlists, or channels, and creators can save up to 50 reports under current YouTube guidance.
Useful comparison questions include whether certain topics, editing styles, video lengths, or traffic sources repeatedly behave differently. However, correlation is not proof of cause.
YouTube itself recommends treating Analytics as an ongoing cycle of reviewing data, identifying insights, and applying what you learn.
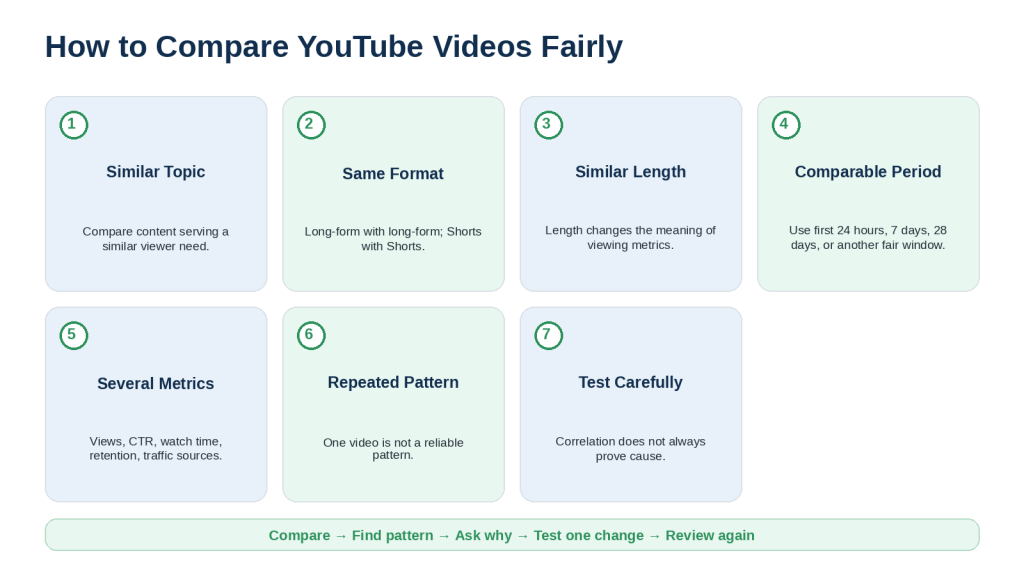
Figure 10. Fair video comparisons use similar content, comparable time periods, and several relevant metrics to identify repeated performance patterns.
Explanation: Treat comparisons as evidence for testing, not proof that one factor caused the result. One unusually strong or weak video is not automatically a reliable pattern.
How to Use Advanced Mode Without Becoming Overwhelmed
Advanced Mode gives you deeper control over content, dates, breakdowns, metrics, filters, comparisons, charts, saved reports, and exports. You do not need to use all of these at once.
Use this simple sequence: Content → Date → Metric → Comparison.
1. Write one question.
2. Choose the relevant video, group, playlist, or channel.
3. Choose a fair date range.
4. Select only the metrics needed for the question.
5. Add a comparison or filter only if it helps answer the question.
6. Write down one useful insight and one possible test.
YouTube currently allows groups of up to 500 videos, playlists, or channels, saved reports up to 50, and export of the current view. Downloaded reports can have row limits, so check current Help guidance when exporting large datasets.
If you use AI to analyze an exported report, tell the AI to use only the supplied data, identify possible patterns, preserve uncertainty, and not invent missing metrics or claim causation.
That is enough to make Advanced Mode useful without allowing Analytics to take over your entire content-creation process.
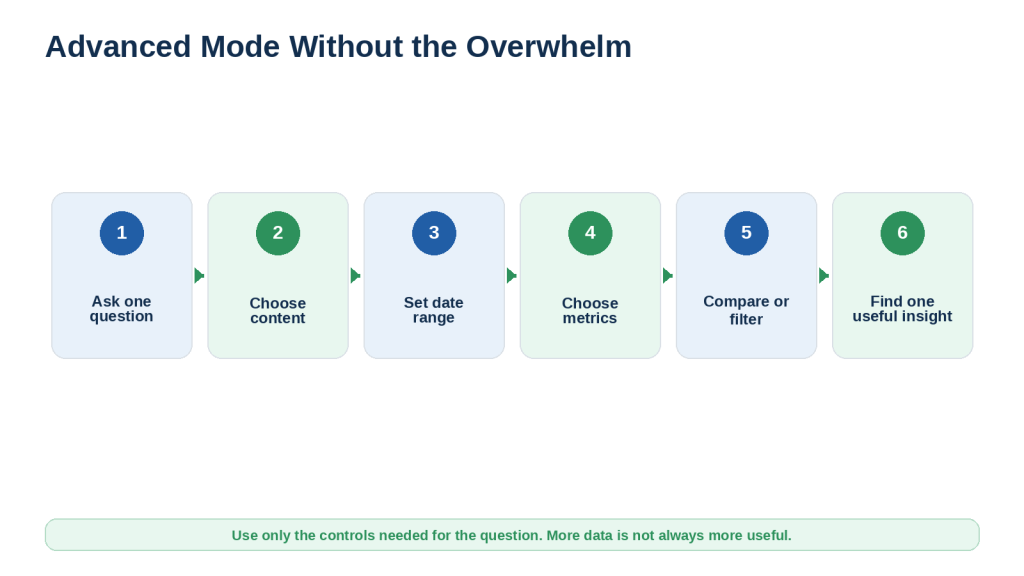
Figure 11. Advanced Mode is easier to use when you begin with one question and select only the content, dates, metrics, comparisons, and filters needed to investigate it.
Explanation: A focused question is more useful than collecting every available metric. Finish with one insight and one practical improvement to test.
How to Review Shorts Analytics Separately
Shorts should usually be analyzed separately from long-form videos because the viewer experience is different. Current Shorts reports can include Views, Engaged views, Shown in feed, Stayed to watch, average view duration, average percentage viewed, traffic sources, likes, subscribers, and remix information where available.
Starting March 31, 2025, YouTube changed Shorts views so a view counts when a Short starts to play or replay, with no minimum watch-time requirement. The previous Shorts view methodology remains available as Engaged views, which reflects occasions where viewers chose to continue watching.
YouTube states that YPP eligibility and Shorts ad revenue sharing continue to use Engaged views rather than the broader public Shorts view count.
Shown in feed describes how often the Short appeared in the Shorts Feed. Stayed to watch describes the percentage of occasions viewers stayed rather than swiping away. For Shorts, average view duration and average percentage viewed are based on engaged viewing behaviour.
Do not compare every Short with a viral hit or rely on one fixed Stayed-to-watch benchmark. Compare similar Shorts and look for repeated patterns.
A useful Shorts strategy focuses on real viewer behaviour and repeated patterns, not one headline number.
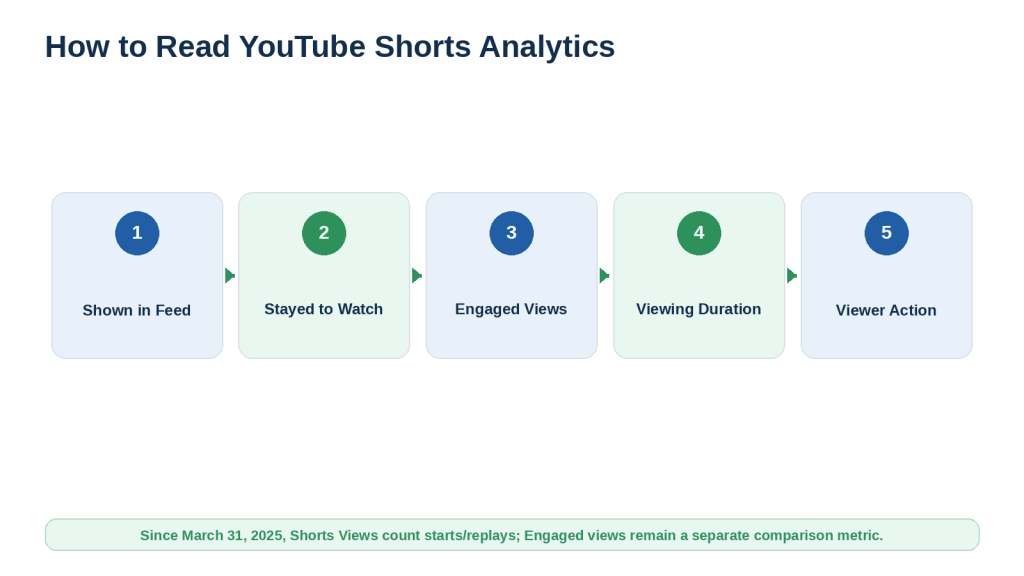
Figure 12. Shorts Analytics is easier to understand when you separate feed exposure, the decision to stay or swipe, engaged viewing, viewing duration, and later viewer actions.
Explanation: Since the 2025 view-count change, combine the public Views metric with Engaged views, Stayed to watch, viewing duration, traffic sources, and other relevant signals.
AI-assisted Shorts still require human review, factual checking, licensing checks, and AI disclosure when YouTube’s current rules require it. Do not mass-produce repetitive Shorts simply because one format performed well.
How to Use Comments and Viewer Feedback With Analytics
Analytics shows what viewers did. Comments show what some viewers chose to say. Neither source is complete by itself.
• Use comments to find repeated questions.
• Look for reports of confusing explanations, unreadable text, audio problems, caption errors, factual mistakes, or missing steps.
• Verify factual corrections before changing the article or video.
• Do not treat one negative comment as representative of the entire audience.
YouTube provides comment moderation controls such as holding potentially inappropriate comments, blocked words, link controls, hidden users, and moderation permissions. Comments with blocked words or links can be held for review for up to 60 days under current guidance.
YouTube has also been rolling out AI-assisted ways to find and manage comments by broader topic or meaning. Availability can vary, so do not assume every channel sees the same tool.
If you use AI to summarize comments, remove unnecessary personal information and tell the AI to organize only real comments you provide. Do not invent viewer feedback.
Use: Analytics + Viewer Feedback + Human Review.
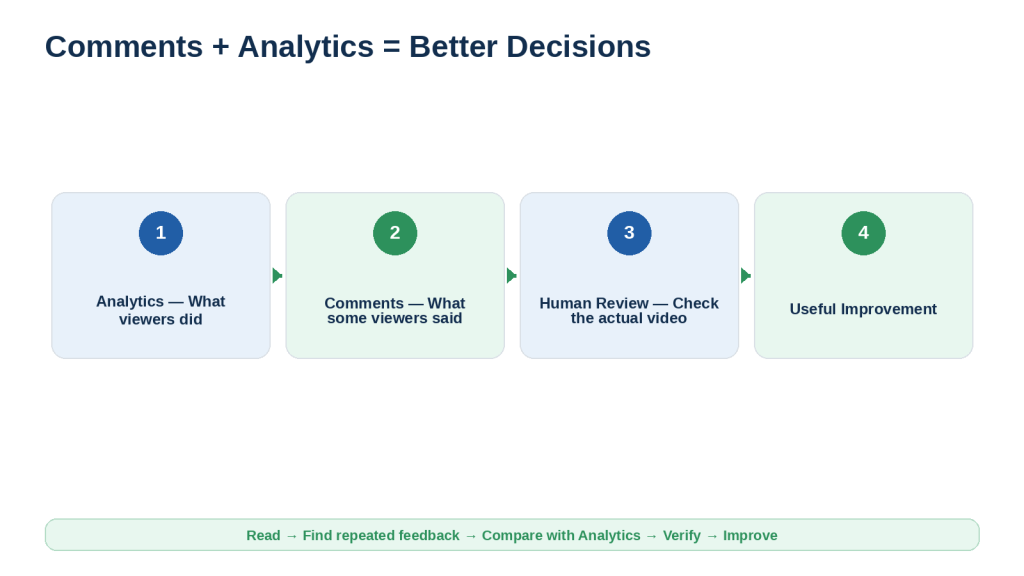
Figure 13. Comments can provide useful context for Analytics when repeated viewer feedback is compared with actual performance data and a human review of the video.
Explanation: Analytics describes behaviour, comments add context, and human review checks what actually happened in the content. Together they can support measured improvements.
How to Use YouTube Analytics to Plan Your Next Videos
Analytics can help you plan future content by showing repeated performance patterns, Search terms, audience interests, strong entry videos, returning-viewer behaviour, and topic requests in comments.
The Trends tab can help you explore searches and content gaps, although some insights are limited by country, language, device, and available data. YouTube’s Inspiration tools can also suggest ideas, titles, thumbnails, and outlines with AI, but YouTube warns that AI-generated suggestions may be inaccurate or inappropriate and should be reviewed.
Use a three-signal rule before choosing a topic: Analytics + Viewer Need + Channel Fit.
• Analytics: Is there evidence that viewers care about this topic or related questions?
• Viewer Need: Does the video solve a clear problem or provide a useful result?
• Channel Fit: Does the topic belong naturally within the purpose of your channel?
Use successful videos as evidence for useful principles, not as a reason to copy the same video repeatedly. If an older video is still useful but has outdated instructions, consider updating or replacing it rather than only creating another version.
The goal is to use real viewer behaviour to make your next content decision more informed.
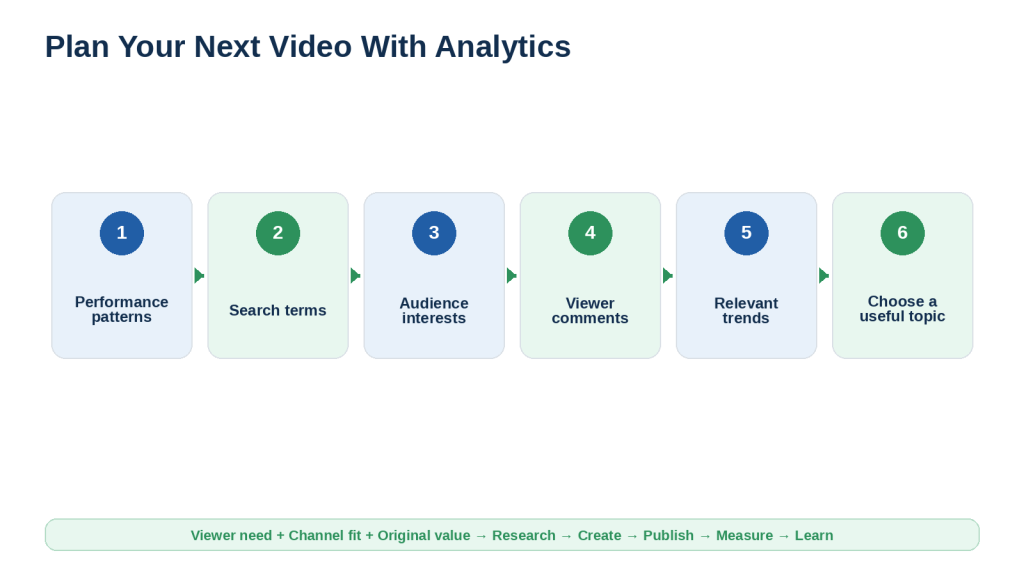
Figure 14. Analytics-based content planning combines performance patterns, Search terms, audience interests, viewer feedback, and relevant trends before choosing the next useful topic.
Explanation: Use several signals, confirm viewer need and channel fit, add original value, and choose one improvement to test in the next video.
How to Build a Simple Monthly YouTube Analytics Review Routine
A monthly review gives enough structure to learn without spending every day watching numbers. Choose a consistent day each month and use the same basic sequence.
1. Open YouTube Studio and Analytics.
2. Choose a consistent date range.
3. Record your main channel numbers.
4. Identify the strongest videos and content types.
5. Investigate unusual increases or declines.
6. Review impressions and CTR.
7. Review watch time and average view duration.
8. Open retention for important videos.
9. Review traffic sources.
10. Review Audience reports.
11. Review Shorts separately.
12. Read useful viewer comments.
13. Review any experiments you ran.
14. Compare similar videos.
15. Use Advanced Mode only when a deeper question requires it.
16. Write three lessons.
17. Choose one to three improvements.
18. Plan the next useful content.
19. Save the review record.
20. Back up important exports and notes.
A simple monthly scorecard can contain six headings: Performance, Discovery, Engagement, Audience, Content, and Feedback. Finish with Next Month.
If you can answer these three questions, your review has done its job: What changed? What did I learn? What will I test next?
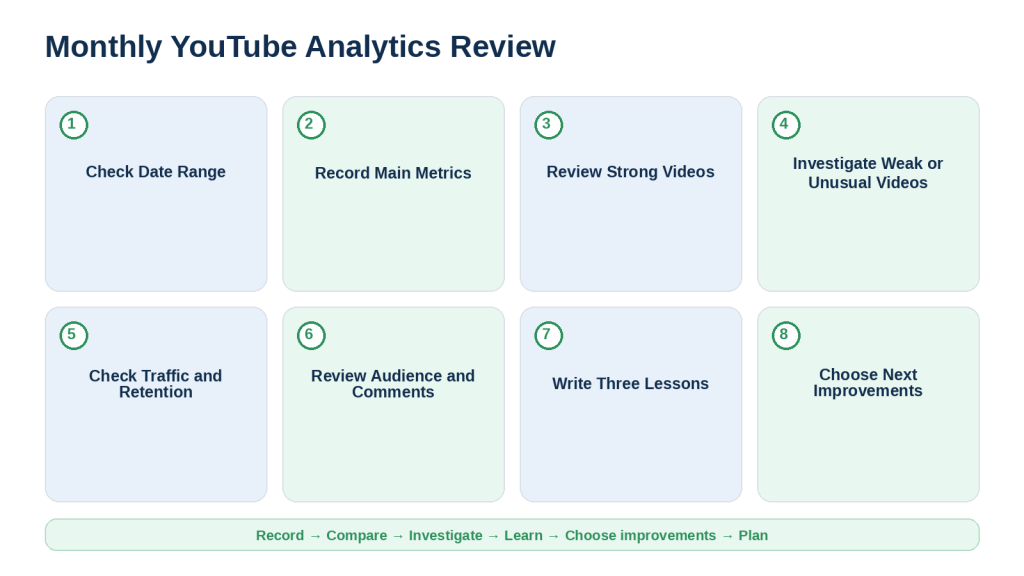
Figure 15. A monthly YouTube Analytics review turns performance data into a small number of useful lessons, improvements, and future content ideas.
Explanation: You do not need every metric every day. A repeatable routine helps you record, compare, investigate, learn, and choose practical improvements.
Common YouTube Analytics Mistakes Beginners Should Avoid
Mistake 1: Looking Only at Views
Views are important, but they do not explain discovery, viewing duration, retention, or audience behaviour.
How to Avoid This Mistake: Check the metric group that matches the question.
Mistake 2: Treating CTR as a Universal Score
CTR varies by audience, content, and where the impression appeared.
How to Avoid This Mistake: Compare your own similar videos and include impressions and traffic source context.
Mistake 3: Blaming the Thumbnail for Weak Viewing
A thumbnail can affect the choice to watch but cannot explain what happened after the click.
How to Avoid This Mistake: Check retention, watch time, and the actual video before changing packaging.
Mistake 4: Treating Every Retention Dip as Bad
A dip only shows that behaviour changed.
How to Avoid This Mistake: Watch the corresponding section and look for repeated evidence.
Mistake 5: Treating Every Spike as Success
A spike may reflect replay, sharing, confusion, or another behaviour.
How to Avoid This Mistake: Review the video section before interpreting it.
Mistake 6: Comparing Shorts With Long Videos
The formats use different viewer experiences and some different metrics.
How to Avoid This Mistake: Compare similar content whenever possible.
Mistake 7: Confusing Shorts Views With Engaged Views
Since March 31, 2025, public Shorts Views and Engaged views measure different things.
How to Avoid This Mistake: Check the metric name before comparing performance or monetization-related progress.
Mistake 8: Drawing Conclusions From Tiny Samples
A few viewers can change a percentage dramatically.
How to Avoid This Mistake: Check the underlying sample size and allow more data to develop.
Mistake 9: Treating Missing Data as Zero
Some detailed data is hidden when reporting thresholds are not met.
How to Avoid This Mistake: Label it as unavailable or limited rather than inventing a zero.
Mistake 10: Comparing Different Time Periods
Lifetime versus first seven days is not a fair comparison.
How to Avoid This Mistake: Use comparable windows.
Mistake 11: Comparing Unrelated Topics or Formats
Topic and viewer intent affect metrics.
How to Avoid This Mistake: Group similar content before comparing.
Mistake 12: Treating Correlation as Cause
Two changes happening together do not prove one caused the other.
How to Avoid This Mistake: Use careful wording and repeat tests.
Mistake 13: Changing Too Many Things at Once
If you change title, thumbnail, intro, length, and editing together, later results are hard to interpret.
How to Avoid This Mistake: Change one meaningful variable at a time when practical.
Mistake 14: Reacting to Every Daily Change
Normal performance moves from day to day.
How to Avoid This Mistake: Use a scheduled review routine.
Mistake 15: Explaining Everything as “the Algorithm”
That phrase hides the actual question.
How to Avoid This Mistake: Check impressions, traffic sources, CTR, retention, and viewer response.
Mistake 16: Refreshing Realtime Constantly
Realtime is estimated and can differ from final counts.
How to Avoid This Mistake: Use it for awareness, not final conclusions.
Mistake 17: Copying Another Creator’s Numbers
Another channel has different viewers, history, topics, and traffic sources.
How to Avoid This Mistake: Use your own comparable history as the main reference.
Mistake 18: Copying a Successful Video Repeatedly
One strong result does not guarantee the same result again.
How to Avoid This Mistake: Reuse principles, not repetitive content.
Mistake 19: Ignoring Lower-View Videos
A lower-view video may still have strong engagement or serve an important audience need.
How to Avoid This Mistake: Review several metrics and the purpose of the video.
Mistake 20: Deleting a Weak Video Too Quickly
Early data may be incomplete.
How to Avoid This Mistake: Investigate accuracy, search potential, and viewer value before deleting.
Mistake 21: Ignoring Viewer Feedback Because Metrics Look Strong
Metrics do not reveal every technical or factual problem.
How to Avoid This Mistake: Read repeated comments and review the actual video.
Mistake 22: Assuming Analytics Proves Viewer Satisfaction
Analytics measures behaviour, not every feeling or reason.
How to Avoid This Mistake: Treat satisfaction as something you infer cautiously from several signals.
Mistake 23: Chasing Only Higher Numbers
A higher number is not always better without context.
How to Avoid This Mistake: Ask what the metric measures and whether it supports the viewer goal.
Mistake 24: Buying Views, Subscribers, or Engagement
Artificial activity can create misleading data and policy risk.
How to Avoid This Mistake: Build real viewer interest through useful content.
Mistake 25: Treating Advanced Mode as Automatic Strategy
Advanced Mode gives more data, not automatic decisions.
How to Avoid This Mistake: Begin with one question and end with one test.
Mistake 26: Tracking Too Many Metrics
Too many metrics can create analysis paralysis.
How to Avoid This Mistake: Track the small group that supports your current goal.
Mistake 27: Assuming Past Analytics Guarantees the Future
Viewer interests and platform conditions can change.
How to Avoid This Mistake: Use past data as evidence for the next test, not as a promise.
A better mindset is: What does this metric measure? What other information do I need? Is there a repeated pattern worth acting on?
Beginner Rule: Observe → Ask → Compare → Verify → Improve. Do not use: See Number → Panic → Change Everything.
Analytics works best when it helps you make calmer, more informed decisions about your content.
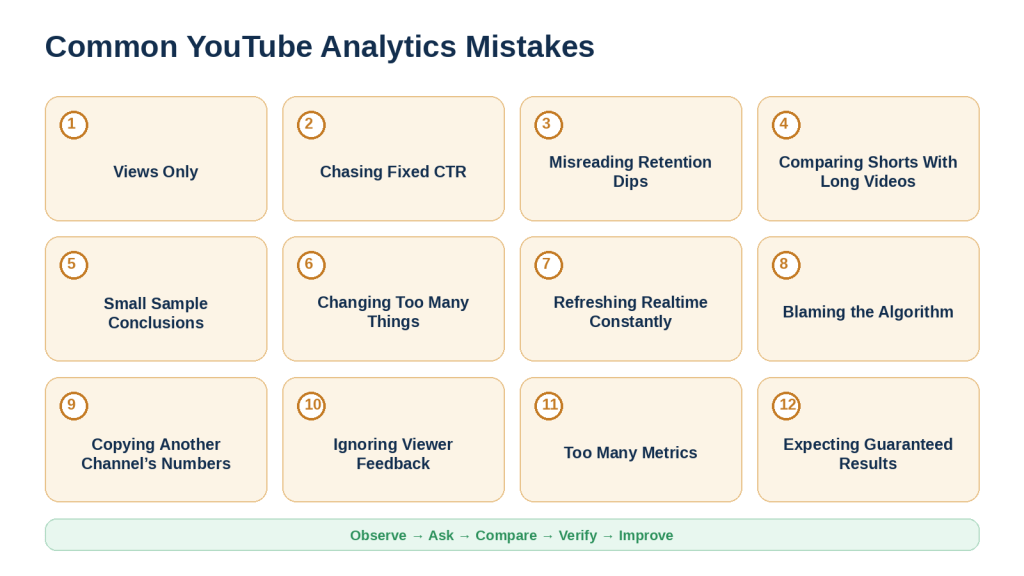
Figure 16. Common Analytics mistakes include relying on one metric, comparing unsuitable content, reacting to small samples, changing too many variables, and treating past performance as a guarantee.
Explanation: Use relevant signals, context, repeated patterns, viewer feedback, and human review. Make measured improvements rather than reacting to every number.
Benefits of Using YouTube Studio and Analytics for a Faceless Channel
YouTube Studio and YouTube Analytics can help you manage a faceless channel more systematically. The main benefit is being able to make decisions using actual viewer behaviour instead of guessing.
Benefit 1: See What Is Actually Happening
Use measurable information such as views, watch time, discovery, audience, and content performance instead of relying only on feelings.
Benefit 2: Identify Stronger Content Patterns
Repeated performance across several similar videos can help you recognize useful topics and formats.
Benefit 3: Understand Discovery
Traffic sources help you learn whether viewers arrive through Search, Browse, Suggested videos, external links, playlists, or other paths.
Benefit 4: See What Happens After the Click
CTR explains the choice to watch; watch time and retention help explain what happened next.
Benefit 5: Improve Video Structure
Retention can point you toward introductions, explanations, pacing, demonstrations, or visuals that deserve review.
Benefit 6: Learn More About Your Audience
Audience reports provide useful patterns about active viewers, devices, geographies, and related interests when enough data exists.
Benefit 7: Build Content for Returning Viewers
Series and related tutorials can help viewers continue learning even when the channel is faceless.
Benefit 8: Improve Titles and Thumbnails Carefully
Use impressions, CTR, views, and post-click viewing behaviour together instead of redesigning packaging because of personal preference alone.
Benefit 9: Find Problems Earlier
Analytics and comments can reveal technical, discovery, pacing, or clarity issues before you repeat them across many videos.
Benefit 10: Learn From Strong Videos Without Copying Them
Study principles such as topic relevance, clearer packaging, stronger intros, and useful traffic sources rather than duplicating one upload.
Benefit 11: Compare Videos More Fairly
Advanced Mode can help compare similar content, groups, time periods, and metrics.
Benefit 12: Keep Better Records
Exports and monthly notes make it easier to remember what changed and what you tested.
Benefit 13: Make Focused Improvements
Analytics can narrow a broad problem into a more specific test, such as shortening an introduction.
Benefit 14: Reduce Random Content Decisions
Combine Analytics, Search questions, viewer comments, channel fit, and research before choosing topics.
Benefit 15: Understand Active Audience Size Better
Monthly audience and unique viewers provide context beyond subscriber count.
Benefit 16: Discover Videos Reaching New Audiences
Unique-viewer information can help identify videos that reached people beyond the existing subscriber base.
Benefit 17: Support Accessibility Improvements
Viewer behaviour and comments can reveal unreadable text, caption problems, pacing issues, or confusing demonstrations.
Benefit 18: Manage Shorts Separately
Separate analysis prevents long-form expectations from being applied to Shorts incorrectly.
Benefit 19: Create a Repeatable Learning Process
Publish → Measure → Review → Learn → Improve → Publish Again.
Benefit 20: Base Decisions on Your Own Channel
Your own comparable history is usually more useful than an unsupported universal benchmark.
Benefit 21: Avoid Overreacting to One Metric
Different reports answer different questions, which makes one-number panic less likely.
Benefit 22: Make the Workflow More Efficient
Focus work where there is evidence of a meaningful issue rather than changing everything.
Benefit 23: See Beyond Subscriber Count
Discovery, engagement, audience, and content reports give a broader picture than subscribers alone.
Benefit 24: Improve Without Showing Your Face
You can study topics, narration, visuals, pacing, titles, thumbnails, and audience interests without appearing on camera.
Benefit 25: Make Decisions More Calmly
Analytics can replace “I have no idea what happened” with “Here are the areas I should investigate.”
Analytics Still Does Not Guarantee Success
Analytics cannot guarantee more views, more subscribers, viral performance, monetization approval, a successful topic, a successful thumbnail, or future recommendation exposure. It is a measurement and learning system, not a promise.
A simple benefits summary is: understand performance, find discovery patterns, study engagement, understand audience behaviour, compare videos, improve packaging, identify content ideas, review Shorts separately, use comments, keep records, test improvements, and make better-informed decisions.
The main benefit is not More Data. It is Better Questions and Better-Informed Decisions.
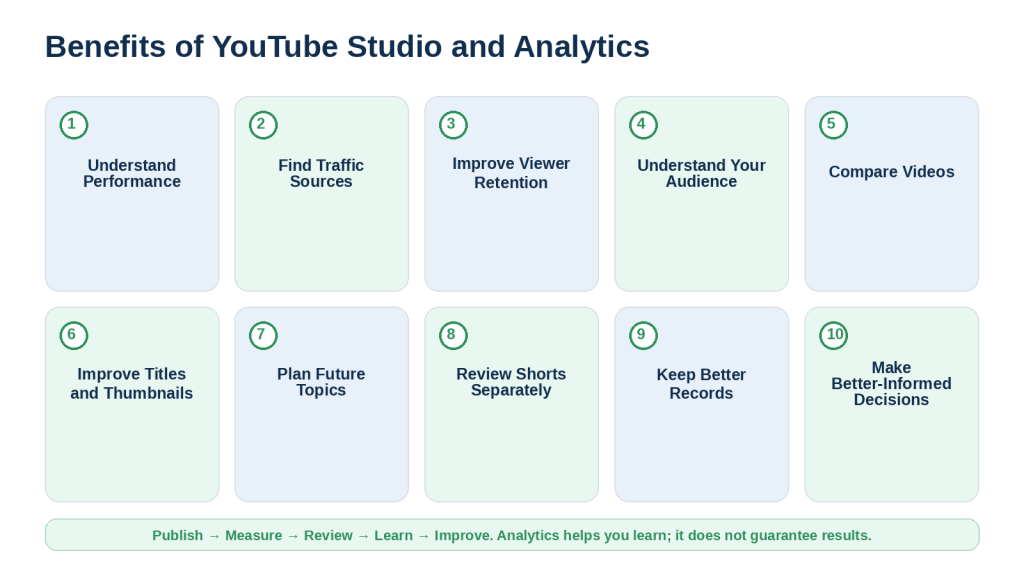
Figure 17. YouTube Studio and Analytics can help faceless creators understand performance, audience behaviour, discovery, content patterns, and areas for future improvement.
Explanation: The value of Analytics comes from turning viewer behaviour into useful questions and measured decisions. It can support improvement but cannot guarantee future views, subscribers, monetization, or growth.
Limitations of YouTube Analytics
YouTube Analytics is useful, but it has limits. It can help you understand measurable viewer behaviour and identify patterns, but it cannot tell you everything about why a viewer made a particular decision or guarantee what will happen next.
Use Analytics as Evidence — Not as Perfect Knowledge.
Limitation 1: Analytics Cannot Read a Viewer’s Mind
It can show where behaviour changed, but not the exact private reason a viewer clicked, left, replayed, or returned.
How to Reduce This Limitation: Use Analytics to identify where something happened, then review the content and comments to investigate why.
Limitation 2: Some Analytics Data Is Limited
YouTube limits some detailed data when reporting thresholds are not met.
How to Reduce This Limitation: Do not invent missing information; label it unavailable or limited.
Limitation 3: Detailed Rows May Not Add Up to the Total
Low-volume details may be hidden even though activity contributes to totals.
How to Reduce This Limitation: Treat visible rows as the reportable breakdown, not every individual action.
Limitation 4: Small Channels May Have Very Little Data
New channels may not yet have stable audience, demographic, traffic, or retention patterns.
How to Reduce This Limitation: Combine early data with research and content review while more activity develops.
Limitation 5: Small Samples Can Produce Unstable Percentages
A few views can change CTR, retention, or conversion percentages dramatically.
How to Reduce This Limitation: Check the underlying sample size before making major decisions.
Limitation 6: Some Metrics Are Estimates
Unique viewers and some other values are estimates rather than exact counts of identified people.
How to Reduce This Limitation: Describe them as estimates.
Limitation 7: Realtime Data Is Not Final Data
YouTube says Realtime activity shows estimates of potential view activity.
How to Reduce This Limitation: Use Realtime for early awareness, not final conclusions.
Limitation 8: Some Reports Need Processing Time
Audience-retention and other reports can take time to populate.
How to Reduce This Limitation: Allow processing time before a detailed review.
Limitation 9: Revenue Information Can Be Delayed or Adjusted
Estimated revenue is not the same as finalized payment information.
How to Reduce This Limitation: Use finalized financial reports when accounting accuracy matters.
Limitation 10: Analytics Cannot Prove Cause and Effect
A change in thumbnail, views, and CTR occurring together does not prove exact causation.
How to Reduce This Limitation: Repeat comparable tests and use cautious wording.
Limitation 11: Different Videos Attract Different Audiences
Topic, length, intent, traffic, and format affect performance.
How to Reduce This Limitation: Compare reasonably similar content.
Limitation 12: Metric Definitions Can Change
Historical comparisons can become difficult when YouTube changes a metric, as happened with Shorts views in 2025.
How to Reduce This Limitation: Check current definitions before long-term comparisons.
Limitation 13: The Studio Interface Can Change
YouTube began gradually rolling out an updated Studio experience in July 2026.
How to Reduce This Limitation: Learn the purpose of reports, not only button positions.
Limitation 14: Some Reports Are Not Available Everywhere
Desktop and mobile can show different levels of detail.
How to Reduce This Limitation: Use desktop Studio when deeper analysis is needed.
Limitation 15: Analytics Cannot Fact-Check Your Video
Strong performance does not prove the information is correct.
How to Reduce This Limitation: Verify important claims separately.
Limitation 16: Analytics Cannot Confirm Copyright Permission
Views and retention do not prove that music, images, footage, fonts, templates, or voices are properly licensed.
How to Reduce This Limitation: Keep separate rights and licence records.
Limitation 17: Analytics Cannot Decide Whether AI Disclosure Is Required
Disclosure is a publishing-policy question, not an Analytics metric.
How to Reduce This Limitation: Review current YouTube disclosure guidance.
Limitation 18: Good Analytics Does Not Guarantee Monetization
Performance and YouTube Partner Program review are separate matters.
How to Reduce This Limitation: Treat monetization compliance as a separate workflow.
Limitation 19: Analytics Cannot Guarantee Future Views
Past performance is not a promise of future recommendations or audience interest.
How to Reduce This Limitation: Use past data to inform the next test.
Limitation 20: A Successful Pattern Can Stop Working
Viewer interests, search demand, software, and YouTube features can change.
How to Reduce This Limitation: Review performance periodically.
Limitation 21: Analytics Can Encourage Overreaction
Frequent checking can make ordinary movement feel important.
How to Reduce This Limitation: Use scheduled reviews and a clear reason for changes.
Limitation 22: Analytics Can Create Analysis Paralysis
Creators can spend more time measuring than creating.
How to Reduce This Limitation: Finish each review with one main insight and one useful action.
Limitation 23: Automated Tools Cannot Give a Guaranteed Explanation
AI can organize supplied Analytics but cannot know exactly what viewers thought.
How to Reduce This Limitation: Ask AI for patterns and questions, not certainty about motives.
Limitation 24: AI Analysis Is Only as Good as the Data You Provide
Missing context can make an AI comparison weak.
How to Reduce This Limitation: Provide relevant metrics and tell the AI not to invent missing data.
Limitation 25: Analytics Exports Can Contain Private Information
Reports may contain revenue, audience, and business data.
How to Reduce This Limitation: Remove unnecessary private information and review the receiving service’s privacy controls before sharing.
Limitation 26: Analytics Does Not Replace Human Review
A graph cannot understand your teaching goal, script, and visual choices the way a careful creator can.
How to Reduce This Limitation: Use Data + Video Review + Viewer Feedback + Judgment.
A better way to think about Analytics is: Analytics will show me where I should ask better questions.
Beginner Rule: Measure → Recognize the Limits → Investigate → Compare → Make a Careful Decision.
YouTube Analytics is a powerful measurement tool, but it works best when combined with context, human judgment, current information, and repeated evidence.
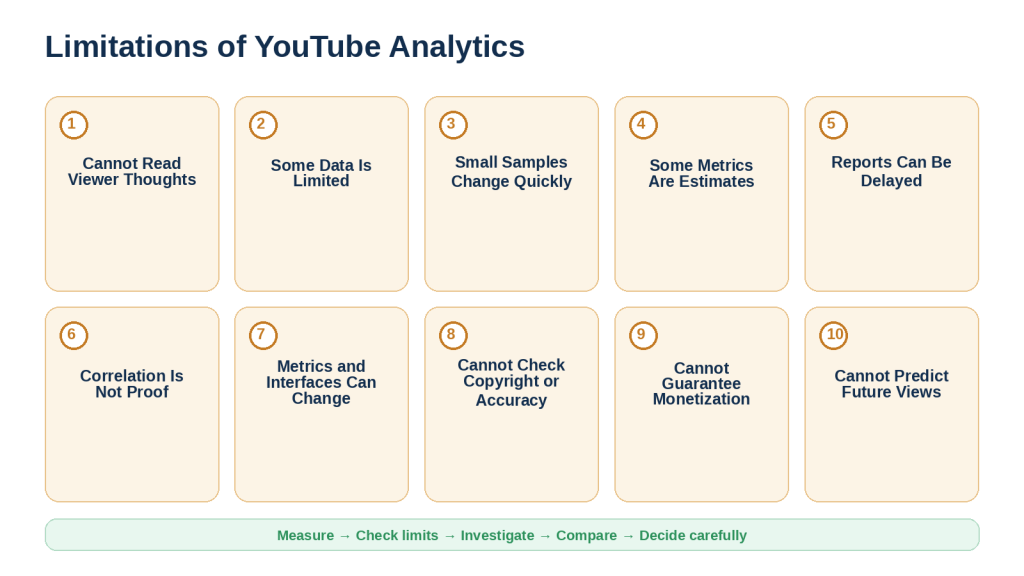
Figure 18. YouTube Analytics has important limitations, including estimated or limited data, processing delays, changing metrics, incomplete explanations of viewer behaviour, and no guarantee of future results.
Explanation: Combine performance data with adequate sample sizes, comparable videos, viewer feedback, human review, and current YouTube guidance before making major decisions.
Myths About YouTube Analytics and Channel Performance
Many unofficial rules turn complicated viewer behaviour into simple formulas. Current YouTube guidance describes search and discovery as personalized systems based on performance and viewer interests, not one secret metric.
Myth 1: “A High CTR Guarantees More Views”
Reality: CTR matters, but it does not guarantee continued impressions or strong post-click viewing.
Myth 2: “There Is One Perfect CTR for Every Channel”
Reality: CTR varies by content, audience, and where the impression was shown.
Myth 3: “High Audience Retention Guarantees Recommendations”
Reality: Retention is useful, but recommendations use multiple viewer and content signals.
Myth 4: “YouTube Only Cares About Watch Time”
Reality: YouTube describes its systems as trying to connect viewers with content they are likely to watch and enjoy, including satisfaction-related signals.
Myth 5: “Longer Videos Always Perform Better”
Reality: Length should match the viewer need. Unnecessary length can reduce clarity.
Myth 6: “Short Videos Cannot Succeed”
Reality: YouTube does not state that one ordinary video format or length is automatically preferred.
Myth 7: “If Views Drop, YouTube Is Punishing My Channel”
Reality: A decline can have many explanations, including topic demand, competition, traffic changes, or viewer response.
Myth 8: “The Algorithm Likes or Hates My Channel”
Reality: That wording hides the measurable question. Check discovery, choice, viewing, and audience data instead.
Myth 9: “Every New Video Gets the Same Fixed Test Audience”
Reality: YouTube does not document one universal fixed test number for every upload.
Myth 10: “Fewer Impressions Automatically Means a Bad Video”
Reality: Low impressions raise a discovery question, not an automatic quality conclusion.
Myth 11: “Every View Comes From a Counted Impression”
Reality: Some discovery paths do not count as registered thumbnail impressions.
Myth 12: “A Viral Video Shows Exactly What I Should Make Forever”
Reality: One exceptional result is evidence to investigate, not a permanent formula.
Myth 13: “More Uploads Automatically Mean More Growth”
Reality: Publishing frequency does not replace originality, usefulness, accuracy, and viewer value.
Myth 14: “You Must Upload Every Day”
Reality: YouTube does not require one universal daily schedule for discovery.
Myth 15: “Subscribers Determine How Many Views Every Video Should Get”
Reality: Subscribers are not the same as active viewers.
Myth 16: “If People Watch, the Information Must Be Accurate”
Reality: Performance does not fact-check content.
Myth 17: “Strong Analytics Means a Video Is Copyright-Safe”
Reality: Analytics and copyright permission are separate issues.
Myth 18: “Good Performance Guarantees Monetization”
Reality: Monetization uses separate eligibility and policy review.
Myth 19: “AI-Generated Videos Are Automatically Suppressed”
Reality: YouTube’s discovery guidance does not describe AI use by itself as an automatic suppression rule; originality, value, policy compliance, and viewer response still matter.
Myth 20: “AI Analytics Tools Can Tell Me Exactly Why My Video Failed”
Reality: AI can identify possible patterns in supplied data but cannot know each viewer’s thoughts.
Myth 21: “One Bad Video Damages Every Future Video”
Reality: One weak upload does not permanently determine the performance of all future content.
Myth 22: “Changing a Thumbnail Always Resets the Video”
Reality: YouTube explains that performance can change because viewers interact differently with new packaging, not because of a simple automatic reset.
Myth 23: “Tags Are the Main Secret to Getting Recommended”
Reality: Current discovery guidance focuses much more broadly on relevance, performance, and viewer personalization.
Myth 24: “There Is a Secret Analytics Number That Makes a Video Viral”
Reality: There is no official Viral Score metric.
Myth 25: “Analytics Can Predict My Next Video”
Reality: Analytics can inform the next choice but cannot predict future performance with certainty.
When you hear a claim such as “YouTube always does X,” ask whether it is an official current rule, whether it applies to all formats, whether it is only a pattern, and whether several other factors could explain the result.
Beginner Rule: Avoid Secret Formula Thinking. Use Viewer Behaviour + Reliable Evidence + Repeated Patterns + Human Judgment.
The purpose of YouTube Analytics is not to uncover a hidden trick. It is to help you understand your content and audience well enough to make better-informed decisions.
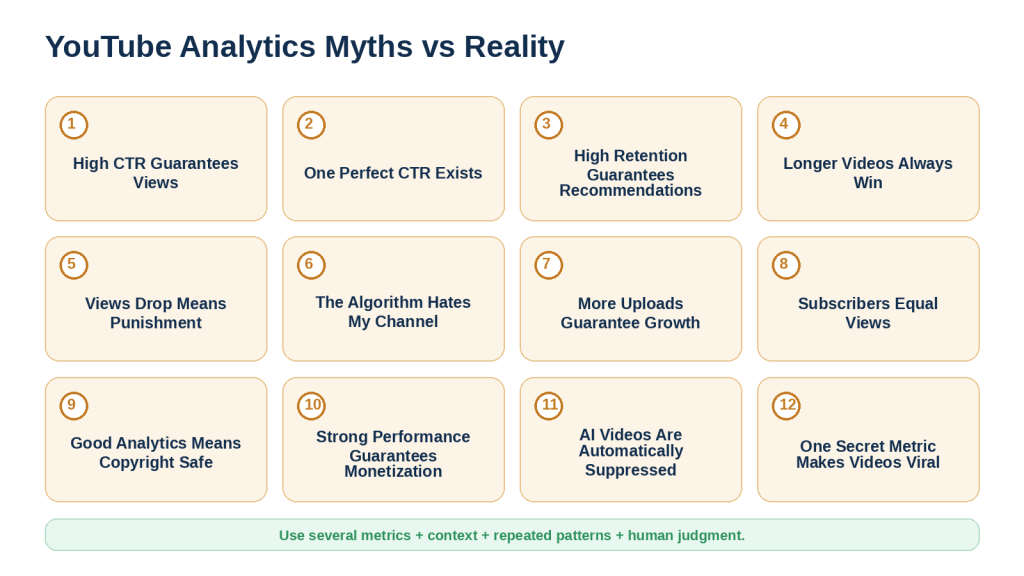
Figure 19. Common YouTube Analytics myths often turn complicated viewer behaviour into unsupported fixed rules or guaranteed formulas.
Explanation: Use current official guidance, several relevant metrics, repeated patterns, and human judgment instead of algorithm hacks or one supposedly perfect number.
Frequently Asked Questions (FAQ)
1. Do I need to understand every YouTube Analytics metric?
No. Start with views, watch time, average view duration, impressions, CTR, retention, traffic sources, and Audience reports. Use Advanced Mode only when a specific question needs more detail.
2. How often should I check YouTube Analytics?
Use a brief post-publishing check for obvious problems, then allow data to develop. A structured monthly review is usually more useful than constant refreshing.
3. Why does my Analytics page look different from tutorials online?
YouTube began gradually rolling out an updated Studio experience in July 2026, and layouts also differ by device, account, and feature availability.
4. What is the difference between channel Analytics and video Analytics?
Channel Analytics shows broad patterns across the channel. Video Analytics investigates one particular upload.
5. Is a higher number of views always better?
More views means more viewing activity, but you still need watch time, retention, traffic, and other context to understand quality and viewer behaviour.
6. What is a good YouTube click-through rate?
There is no single number that every video must achieve. Compare similar videos on your own channel and include impressions and traffic-source context.
7. Why can CTR fall while views increase?
A video can reach a broader audience as impressions grow. CTR may decline while total views still increase.
8. Why do total views not equal impressions multiplied by CTR?
Not every view comes from a registered thumbnail impression.
9. Why is audience-retention information missing?
The report may still be processing or there may not be enough reportable activity.
10. Does every retention drop mean my video is bad?
No. A drop tells you where behaviour changed. Review the corresponding part before deciding why.
11. Why are some Audience reports missing?
YouTube limits some detailed reports when reporting thresholds are not met.
12. What does monthly audience mean?
It is the rolling 28-day total of unique viewers who watched your content, recalculated daily.
13. Are unique viewers exact?
No. YouTube treats unique viewers as an estimate.
14. Should I compare Shorts with long-form videos?
Usually not directly. Compare Shorts with similar Shorts and long-form tutorials with similar long-form tutorials.
15. What is the difference between Shorts Views and Engaged views?
Since March 31, 2025, Shorts Views count starts and replays. Engaged views retain the earlier meaningful-view methodology for viewers who chose to continue watching.
16. Do many Shorts views guarantee monetization progress?
No. YouTube states that YPP eligibility and Shorts ad revenue sharing continue to use Engaged views, and monetization has separate eligibility and policy requirements.
17. Should I delete a video because it performs poorly during the first few days?
Usually not based on early performance alone. Check accuracy, traffic, CTR, retention, search potential, and viewer value first.
18. Should I change my thumbnail whenever CTR drops?
No. CTR changes with impressions, audience, and traffic sources. Change packaging for a clear reason, not every movement.
19. Can Analytics tell me exactly why a video performed badly?
No. It shows measurable behaviour. You still need content review, viewer feedback, and cautious interpretation.
20. Can ChatGPT or another AI analyze my YouTube Analytics?
Yes, if you provide the data. Ask it to identify patterns without inventing missing information or claiming certainty about cause.
21. Is it safe to upload an Analytics export to an AI tool?
Review the file first. Remove unnecessary private, revenue, client, viewer, or commercially sensitive information and check the AI provider’s current privacy controls.
22. Does strong Analytics mean my video is copyright-safe?
No. Rights, licences, permissions, and attribution are separate responsibilities.
23. Does good Analytics guarantee YouTube monetization?
No. YPP eligibility and channel policy review are separate from performance metrics.
24. Does Analytics tell me whether AI disclosure is required?
No. Use current YouTube altered or synthetic content disclosure guidance.
25. Why do videos receive fewer views than the channel has subscribers?
Subscribers are not the same as active viewers. Many subscribers may not watch every upload, while non-subscribers may watch.
26. Why do detailed Analytics rows not add to the total?
Low-volume details can be limited for privacy and reporting thresholds while still contributing to broader totals.
27. Is Advanced Mode necessary for beginners?
No. Use standard Analytics first, then Advanced Mode for a specific comparison or deeper question.
28. What is the most important YouTube Analytics metric?
There is no single most important metric. Use the metric group that answers your question.
29. Can Analytics guarantee that my next video will perform well?
No. It can make the next decision better informed, but it cannot guarantee future views, CTR, recommendations, subscribers, or monetization.
30. What should a complete beginner focus on first?
Use the viewer journey: Discovery → Choice → Watch → Stay or Leave → Return. Connect each stage to only a few relevant metrics.
The most useful beginner question is: What happened, what should I investigate, and what one useful improvement should I test next?
Key Takeaways
• YouTube Studio is the main channel-management area; Analytics is the measurement area.
• Begin with a question, not a random metric.
• Use the viewer journey: Discovery → Choice → Watch → Stay or Leave → Return.
• Views, watch time, average view duration, impressions, CTR, retention, traffic sources, and audience reports answer different questions.
• Do not judge a video from one metric.
• Retention shows where viewer behaviour changes, not the exact reason.
• Traffic sources explain how viewers found content.
• Monthly audience and unique viewers provide context beyond subscriber count.
• New, casual, and regular viewer groups are planning signals and do not directly determine reach or monetization.
• Compare similar videos and comparable time periods.
• Use Advanced Mode for focused questions, not for collecting every available number.
• Review Shorts separately and distinguish Views from Engaged views.
• Comments can add context to Analytics but do not represent every viewer.
• A monthly review can turn data into a small number of useful lessons and tests.
• Some data is estimated, delayed, or limited.
• Analytics cannot verify factual accuracy, copyright permission, AI disclosure, or monetization eligibility.
• Avoid fixed benchmarks, secret formulas, and algorithm-hack claims.
• Strong past performance does not guarantee future results.
• Use Analytics to improve useful, accurate, original, accessible, and responsibly published content.
A simple workflow is: Publish → Measure → Review → Understand → Improve → Publish Again.
Final Tip
Do not use YouTube Analytics to search for a perfect number. Use it to answer one practical question at a time.
• Are viewers finding the video?
• Are they choosing it when they see it?
• Are they staying after they start watching?
• Where do they leave?
• Which topics bring viewers back?
• What one thing should I improve next?
A simple rule for beginners is: One Question → One Useful Metric Group → One Improvement → Test Again.
Keep your focus on Useful Content + Accurate Information + Original Value + Viewer Understanding + Responsible Publishing. Then use Analytics as your feedback system.
Continue Learning
YouTube Analytics becomes more useful when it is connected to the complete faceless-video workflow. Continue with these related AI Mastery guides:
Article 066 — Reused Content, AI Disclosure, and Monetization for Faceless Videos: Beginner Guide (2026)
Review monetization, reused content, repetitive content, AI disclosure, and channel-review requirements.
Article 065 — YouTube Copyright and Licensing for AI Videos: Beginner Guide (2026)
Learn how copyright, licences, music, stock assets, AI-generated material, and permissions affect publishing.
Article 064 — How to Create YouTube Thumbnails, Titles, and Descriptions with AI: Beginner Guide (2026)
Review the elements that influence whether viewers notice and choose your videos.
Article 063 — How to Edit Faceless YouTube Videos and Audio: Beginner Guide (2026)
Improve pacing, structure, visuals, narration, and editing using lessons from retention.
Article 062 — How to Create Visuals for Faceless YouTube Videos with AI Images, Stock Footage, and Screen Recordings: Beginner Guide (2026)
Create clearer and more useful visuals.
Article 061 — How to Create Storyboards and Plan Scenes for Faceless YouTube Videos with AI: Beginner Guide (2026)
Use storyboarding to plan visual flow before editing.
Article 021 — How to Add Voice, Music, and Captions to AI Videos: Beginner Step-by-Step Guide (2026)
Improve narration, audio, music, and captions while considering accessibility and licensing.
Use the series as an improvement map: Weak CTR → review thumbnails and titles. Early retention drop → review scripts, openings, and editing. Confusing demonstrations → review visuals. Audio complaints → review voice, music, and captions. Copyright concerns → review licensing. Monetization questions → review Article 066.
Article 067 completes the planned Faceless YouTube Video Creation Series by showing how to use real channel performance information to improve the workflow covered throughout the earlier articles.
Sources and References
The following official YouTube sources were reviewed for this article on August 8, 2026. YouTube Studio, Analytics reports, metric definitions, and interface layouts can change. Check current official guidance when first using a feature, after important update notices, and periodically.
1. Get started with YouTube Analytics — Channel and video Analytics, Overview, Content, Reach, Engagement, Audience, Revenue, Trends, and current Studio notes.
2. Learn how to use Advanced mode for analytics reports — Advanced Mode access, comparisons, groups, filters, metrics, saved reports, exports, and July 2026 Studio rollout note.
3. Measure key moments for audience retention — Audience-retention access, interpretation, segments, and comparisons with videos of similar length.
4. Understand your YouTube content performance — Content performance, traffic sources, retention, and Shorts content reports.
5. Check your YouTube impressions and watch time — Impressions, CTR, and how impressions lead to views and watch time.
6. Impressions & click-through-rate FAQs — CTR definition, contextual interpretation, and why not every view is tied to a counted impression.
7. Understand your YouTube audience — Monthly audience and Audience reports such as devices, geography, watch time from subscribers, and related viewing.
8. Understand new, casual, & regular viewers — Definitions of new, casual, and regular viewers and the statement that these segments do not directly affect reach or monetization.
9. Understand your unique viewers data — Unique-viewer estimates and comparison guidance.
10. Understand limited data in YouTube Analytics — Reporting thresholds and reasons detailed Analytics information can be limited.
11. Get started creating YouTube Shorts — March 31, 2025 Shorts view-count change, Engaged views, and YPP/revenue-sharing measurement.
12. How engagement metrics are counted — Realtime activity as an estimate of potential view activity.
13. Learn about comment settings — Comment moderation, blocked words, links, held comments, and review periods.
14. Explore trends on YouTube — Trends tab, searches, breakout videos, and availability limitations.
15. Explore the Inspiration tab on YouTube — AI-assisted ideas, titles, thumbnails, outlines, and YouTube’s warning that generated suggestions can be inaccurate or inappropriate.
16. Search & discovery tips — Performance, relevance, and viewer personalization in search and discovery.
17. YouTube performance FAQ & Troubleshooting — Performance questions, title and thumbnail changes, discovery, and viewer response.
18. Creator updates — Recent YouTube creator-feature updates, including community and comment changes.
Important Note: This article provides general educational information and is not legal, financial, or professional advice.


Leave a comment