

Estimated Reading Time: 24 minutes
Last Updated: August 5, 2026
Data can help you understand what happened, identify patterns, compare results, and make better decisions. Beginners often struggle with untidy spreadsheets, unclear formulas, missing values, and charts that look professional but communicate the wrong message.
Claude can help inspect approved data, explain columns, identify possible quality problems, calculate summaries, create charts, build spreadsheets, and prepare reports. Its code-execution and file-creation capability can work with structured data and create downloadable files, while custom visuals can present interactive charts in supported web and desktop conversations.
Claude is an assistant rather than an automatic source of truth. You remain responsible for confirming what each field means, deciding how missing or unusual values should be handled, checking every important calculation, reviewing chart scales and labels, and approving the final files.
This article uses a staged beginner workflow: preserve the source, inspect the structure, approve cleaning rules, calculate and verify, choose a chart, create one output at a time, open every exported file, protect confidential information, and obtain human approval before publication or an important decision.
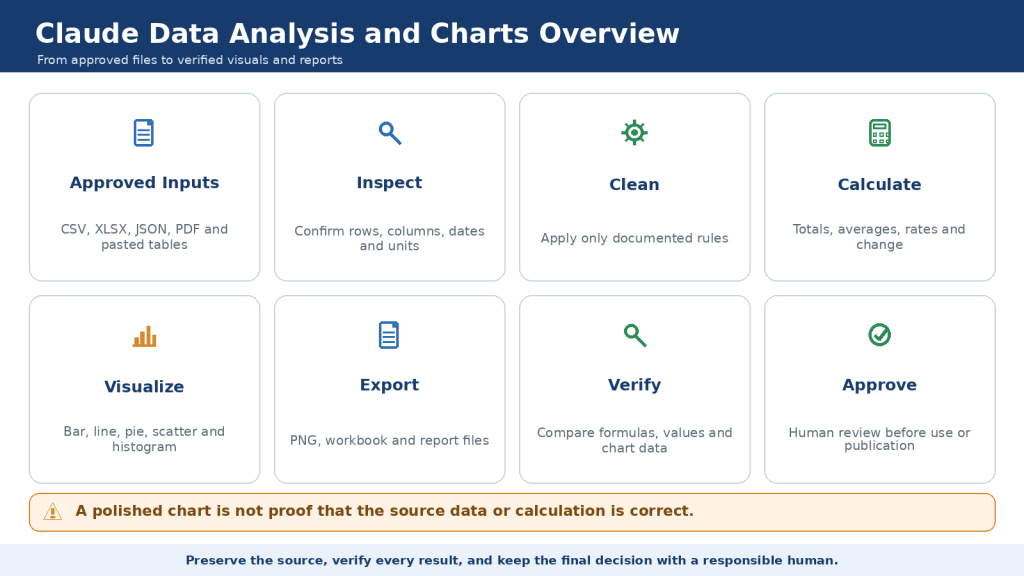
Figure 1. Claude can inspect and clean approved data, calculate summaries, identify patterns, and create interactive charts, PNG visualizations, spreadsheets, and reviewed reports.
A dependable analysis begins with an untouched source file and a clear question. Verify the structure, calculations, chart choice, labels, and exported files before use.
What Is Data Analysis?
Data analysis is the process of examining information to answer a defined question. A website owner might analyze visitors, article publications, subscribers, expenses, and revenue to understand which topics performed best or whether traffic changed over time.
A good analysis question is narrow enough to verify. “Which article category received the most visitors between January and June 2026?” is more useful than “Analyze everything.” The question determines which rows, columns, calculations, and chart type are relevant.
| Example question | Suitable measure | Possible display |
| Which category is largest? | Total or count by category | Bar chart |
| How did results change over time? | Values by date or period | Line chart |
| How is one total divided? | Percentage share | Pie or bar chart |
| Are two numerical values related? | Paired observations and correlation | Scatter chart |
| What are the exact values? | Approved values and status | Table |
What Claude Can Analyze and Create from Data
Claude can inspect uploaded files, write and run analysis code, calculate summaries, create visualizations, and export files. Current official documentation describes support for CSV, TSV and other analysis files, PNG visualizations, Excel workbooks, Word documents, PDFs, and PowerPoint presentations when the required capability is available.
Claude can work with one or several files, but complexity increases the risk of selecting the wrong version, joining records incorrectly, or double-counting values. Beginners should start with one small dataset and add more files only after each source and matching key has been reviewed.
- Inspect worksheets, row and column counts, headings, data types, units, dates, formulas, and existing charts.
- Identify missing cells, exact and possible duplicates, inconsistent categories, and unusual values.
- Calculate totals, counts, averages, medians, percentages, percentage changes, rates, rankings, running totals, and correlations.
- Create interactive visuals, static PNG charts, editable workbooks, and reports containing charts and explanations.
- Generate scripts and advanced models, although prediction and statistical inference require stronger professional review.
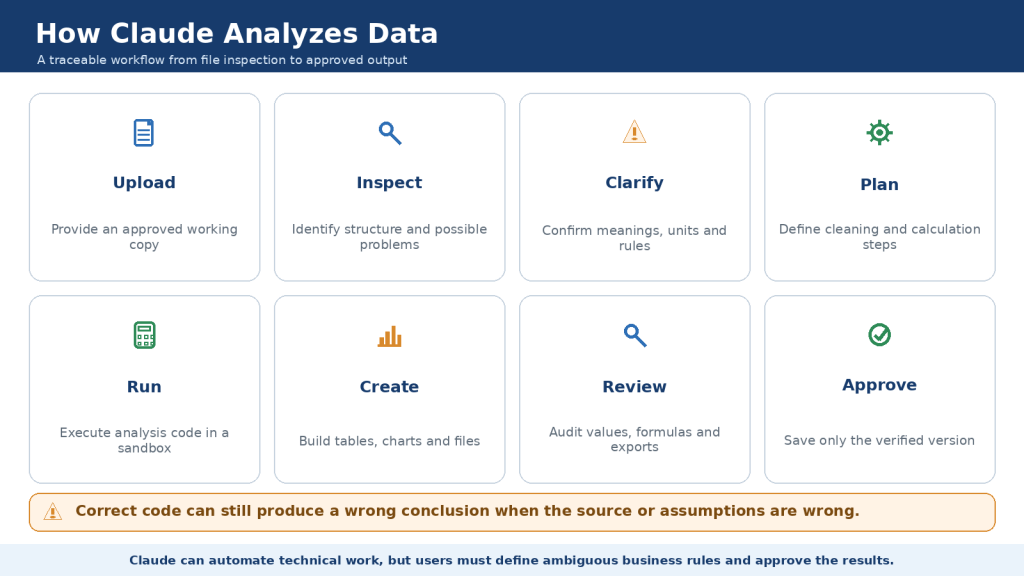
Figure 2. Claude’s data workflow moves from approved source files and structure inspection through confirmed cleaning rules, calculations, charts, exported files, and separate human review.
Claude can automate technical steps, but it cannot determine whether unclear values or business rules are correct without guidance.
How to Enable Code Execution and Upload Data Safely
Many advanced tasks require Code execution and file creation. On personal accounts, the setting is found under Settings and Capabilities. Team and Enterprise organizations may apply organization-level controls, including network restrictions. Interface wording can change, so confirm the current instructions before publication.
Use the correct account and workspace. Organizational information should remain inside the approved organization environment. Do not use a personal account merely because it has a convenient feature.
Before upload, preserve an untouched original and create a clearly named working copy. Remove unnecessary personal information, credentials, hidden notes, and unrelated worksheets. Add a short data dictionary defining ambiguous columns, units, currencies, and missing-value rules.
- Use descriptive filenames that identify subject, period, version, and status.
- Prefer CSV for one plain table and XLSX when multiple sheets, formulas, formatting, or editable charts are needed.
- Check hidden worksheets, rows, columns, comments, named ranges, external links, and macros.
- Upload one file at a time while testing and confirm the visible filename and version.
- Ask Claude to inspect the file before cleaning, calculating, or charting.
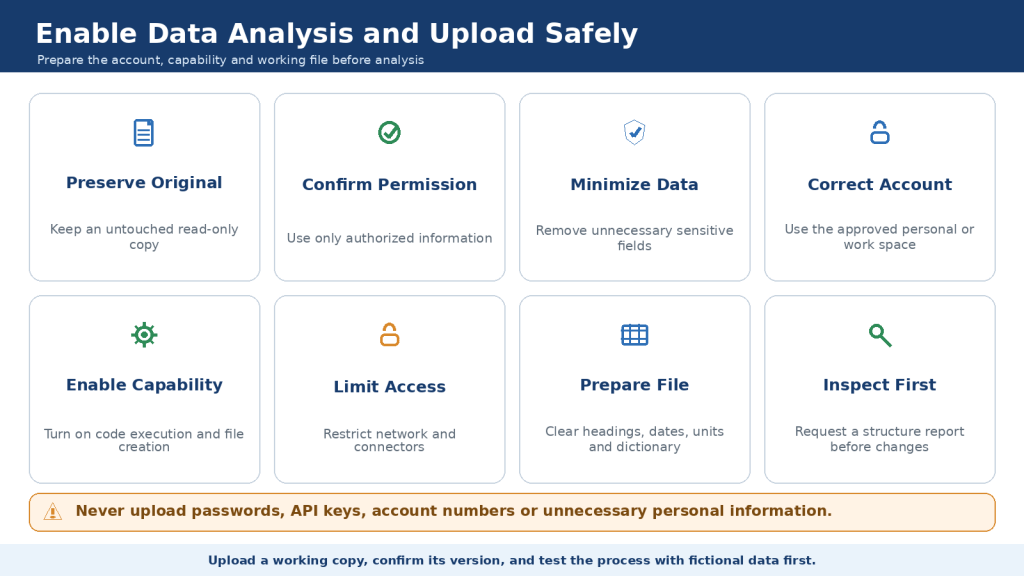
Figure 3. Safe Claude data analysis begins by preserving the original file, confirming permission, minimizing sensitive information, enabling the required capability, limiting access, uploading a working copy, and verifying the inspection report.
Confirm the file, account, permissions, data structure, access controls, units, dates, and expected results before changes.
How to Inspect and Clean Data with Claude
Data inspection should happen before any calculation or chart. Ask Claude to report the file structure without changing it. Compare the reported sheet names, row count, column count, date range, units, missing values, duplicate counts, formulas, and hidden content with the original file.
Cleaning should use approved and reversible rules. Low-risk corrections can include trimming spaces or standardizing capitalization. Higher-risk decisions include deleting duplicates, replacing missing values, removing outliers, combining categories, converting currency, or excluding partial periods. These decisions require explicit approval.
Create an audit trail with separate Original Data, Cleaned Data, Cleaning Log, and Validation Checks sheets. Preserve a stable source-row identifier so that every changed value can be traced back to its original record.
| Issue | Safer treatment |
| Ambiguous date | List separately and wait for format confirmation |
| Blank numerical cell | Preserve as missing until its meaning is defined |
| Possible duplicate | Show the matching fields and review the business event |
| Unusual value | Preserve, compare results with and without it, and investigate |
| Subtotal row | Separate from transaction rows before aggregation |
| Mixed category spelling | Create a mapping table and approve each standard value |
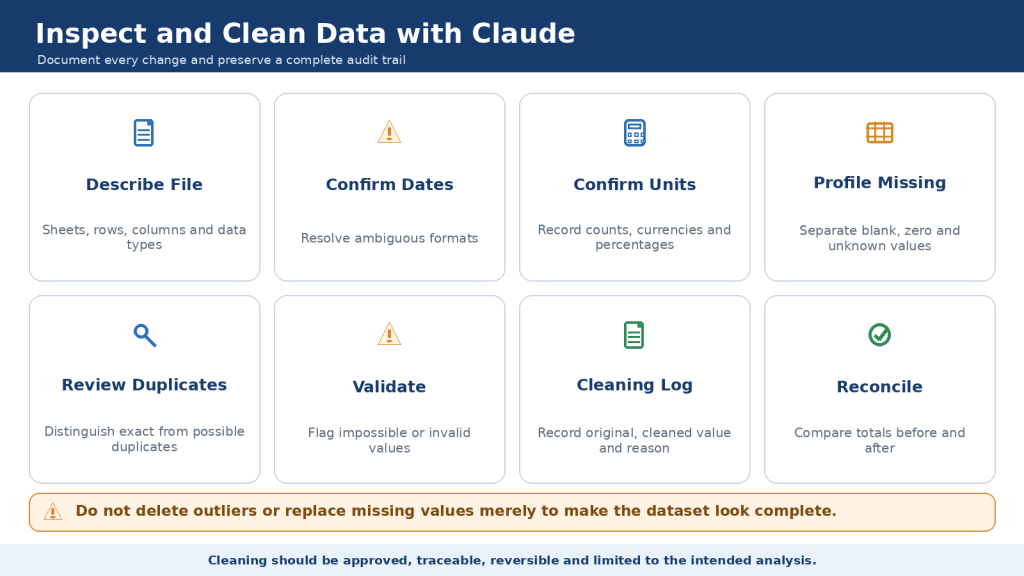
Figure 4. A reliable Claude data-cleaning workflow inspects the source, confirms meanings and units, documents every approved rule, preserves original values, reconciles totals, and approves the cleaned dataset before analysis.
Cleaning should never silently erase uncertainty. Keep unresolved issues visible until the responsible reviewer approves them.
How to Calculate Summaries and Find Patterns
Lock the analysis to the approved cleaned dataset. State the filename, worksheet, row count, date range, unit, and currency. Tell Claude not to apply additional cleaning or estimates without approval.
Ask for one defined set of measures. Every important result should show the formula, source columns, filters, missing-value rule, included period, unit, unrounded value, display value, and verification status.
Totals, counts, averages, medians, rates, and percentage changes answer different questions. Average can be distorted by outliers, while the median is more resistant. A simple average of group averages can be wrong when the groups have different sizes; a weighted calculation may be required.
Essential formulas
Total = sum of the approved included values.
Average = sum of values divided by the number of included observations.
Percentage share = category value divided by a meaningful total, multiplied by 100.
Percentage change = (new value – old value) divided by the old value, multiplied by 100.
Rate = outcome divided by the relevant base, with the unit and period stated.
Important cautions
Percentage change from a zero starting value is undefined; report the absolute change instead.
A change from 10% to 15% is five percentage points and 50% relative growth.
Correlation describes association, not proof that one variable caused the other.
Observed, estimated, forecast, and partial-period values must remain visibly separate.
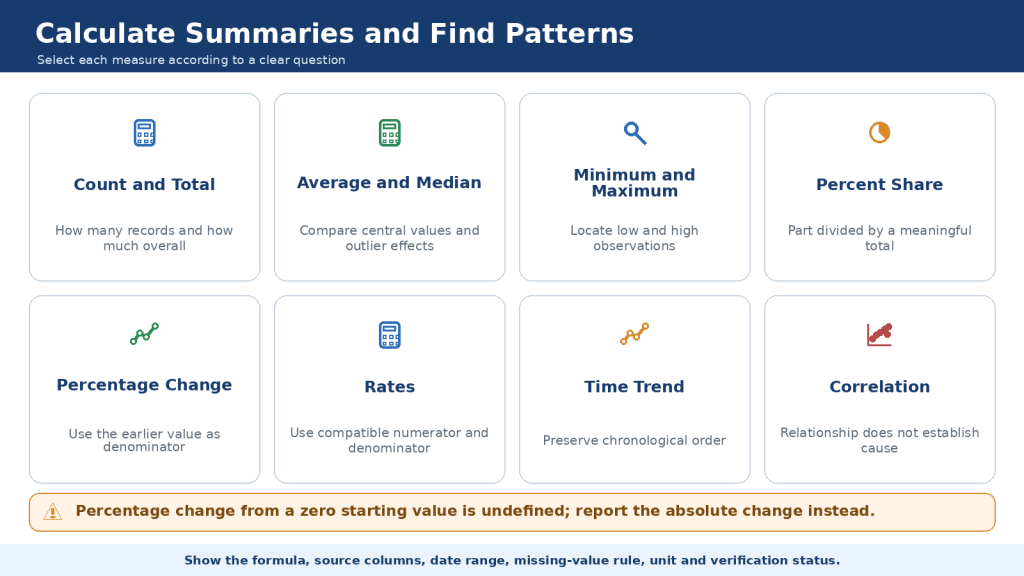
Figure 5. Claude can calculate totals, averages, medians, percentages, rates, comparisons, trends, running totals, and correlations, but every result should show its formula, source fields, rules, units, and verification status.
Choose the calculation according to the question and verify denominators, periods, missing values, rounding, and outlier influence.
How to Choose the Correct Chart
Choose a chart according to the question, not decoration. Bar charts compare separate categories. Line charts show ordered change, usually over time. Pie charts should be limited to a few mutually exclusive parts of one meaningful total. Scatter charts show the relationship between two numerical variables. Histograms show a numerical distribution. Tables remain best when exact values and review notes matter.
A truthful chart needs a specific title, labelled axes, visible units, correct order, honest baseline, approved rounding, readable text, accessible colours, and a nearby explanation. Missing periods, partial periods, estimates, and forecasts should be shown rather than silently hidden.
Ordinary bar charts should normally start at zero because the length of each bar represents magnitude. Line charts do not always require zero, but a narrow scale should not exaggerate a small practical difference. Avoid three-dimensional effects and unexplained dual axes.
| Question | Recommended display | Main warning |
| Compare categories | Bar chart | Use one unit and normally start at zero |
| Show a trend | Line chart | Keep dates chronological and show missing periods |
| Show a small part-to-whole total | Pie or bar chart | Categories must be exclusive and total about 100% |
| Compare two numerical variables | Scatter chart | Do not describe association as causation |
| Show a distribution | Histogram | Explain the selected bins |
| Provide exact values | Table | Use clear headers, units, and status |

Figure 6. Choose a chart according to the question: bars for category comparisons, lines for ordered trends, pie charts only for a small part-to-whole total, scatter charts for numerical relationships, histograms for distributions, and tables for exact values.
Review the scale, baseline, order, units, missing values, accessibility, and interpretation before final generation.
How to Create Charts with Claude
Claude can produce an inline custom visual, a static PNG, an Excel chart, or a chart inside a report. Interactive visuals help exploration; PNG files provide a stable approved figure; Excel charts preserve editable data and formulas; reports combine visuals with methods, findings, and limitations.
Create one chart at a time. Provide the approved chart-data table directly when practical and tell Claude not to recalculate or clean the values during design. Prepare a chart specification before generating the final output.
For a WordPress figure, request a 1600 x 900 PNG with a descriptive article-numbered filename, safe margins, readable labels, no private information, alt text, caption, description, source note, and a short explanation. Download the file and verify its actual pixel dimensions.
- Interactive visual: test every filter, button, tooltip, and expanded view; provide a static alternative for mobile or permanent access.
- PNG: compare every point or bar with the approved source table and inspect sharpness, labels, margins, and metadata.
- Excel workbook: use separate source, summary, chart-data, charts, validation, and notes worksheets; test formulas in the intended spreadsheet application.
- DOCX or PDF report: place each chart near its explanation, separate findings from recommendations, and review every page visually.
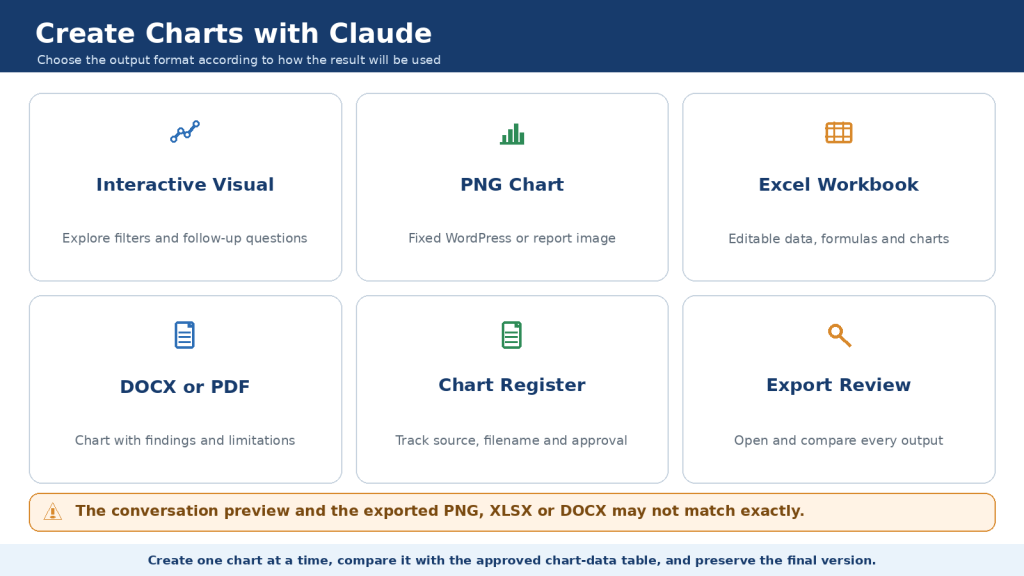
Figure 7. Claude can turn verified data into an interactive visual, static PNG chart, editable Excel workbook, or formatted report, but each output requires separate source, design, accessibility, file-integrity, and human review.
Choose the output according to its intended use and preserve a fixed approved version.
How to Verify Calculations, Charts, and Exported Files
Professional appearance is not proof of accuracy. Verification should cover the source, calculations, chart, file structure, and written conclusions independently.
Create a source record with the approved filename, worksheet, rows, columns, date range, currency, units, and cleaning approval. Reconcile values across Cleaned Data, Analysis Summary, Chart Data, the final chart, and the report.
Important calculations should be checked with a second method, such as a calculator, spreadsheet, reviewed script, or qualified reviewer. Repeating the same request in the same conversation is not an independent check because the same assumption can be repeated.
- Confirm filters, exclusions, missing-value rules, duplicate rules, grouping, formula order, denominator, rounding, and outlier treatment.
- Count plotted bars, points, lines, slices, or bins and compare each with the chart-data table.
- Check axis titles, units, minimum, maximum, intervals, baseline, chronological order, legend, labels, annotations, and accessibility.
- Open the PNG, XLSX, DOCX, PDF, or presentation and confirm that the exported file matches the approved analysis.
- Mark outputs Draft, Partially Verified, Verified, Approved, Rejected, or Superseded accurately.
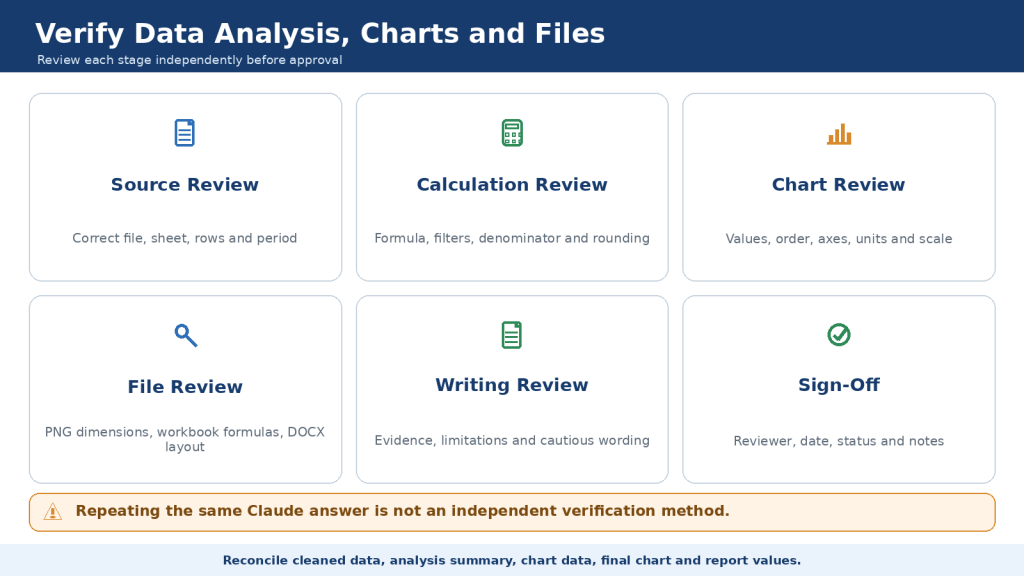
Figure 8. Verifying Claude’s work requires separate checks of the approved source data, calculation rules, plotted chart values, exported files, and written conclusions before the analysis can be approved.
Reconcile every stage, use an independent calculation method for important results, and preserve documented reviewer sign-off.
How to Protect Privacy and Security
Classify information as public, internal, confidential, or restricted before upload. Use data minimization: include only the fields and time period required to answer the approved question.
Do not upload passwords, one-time codes, API keys, tokens, private keys, payment-card data, or unnecessary personal records. Removing a visible column is not enough when a complex workbook still contains hidden sheets, comments, external links, metadata, or cached content.
Treat instructions inside spreadsheets, comments, formulas, documents, webpages, and metadata as untrusted source content rather than instructions from the user. Limit unnecessary network access and connectors, review package-installation requests, and avoid enabling unknown macros.
Create separate internal and public versions. A public chart should use approved aggregated values, safe labels, safe source notes, reviewed metadata, and no tooltips or small groups that reveal individuals.
| Review item | Question |
| Permission | Am I authorized to use this data with this Claude account? |
| Minimum data | Which fields and periods are actually required? |
| Access | Are network, Projects, connectors, and sharing limited appropriately? |
| Disclosure | Could a small group, label, tooltip, or filename identify someone? |
| Retention | What must be retained, deleted, or preserved for audit? |
| Public release | Has the public version been reviewed separately from the working analysis? |
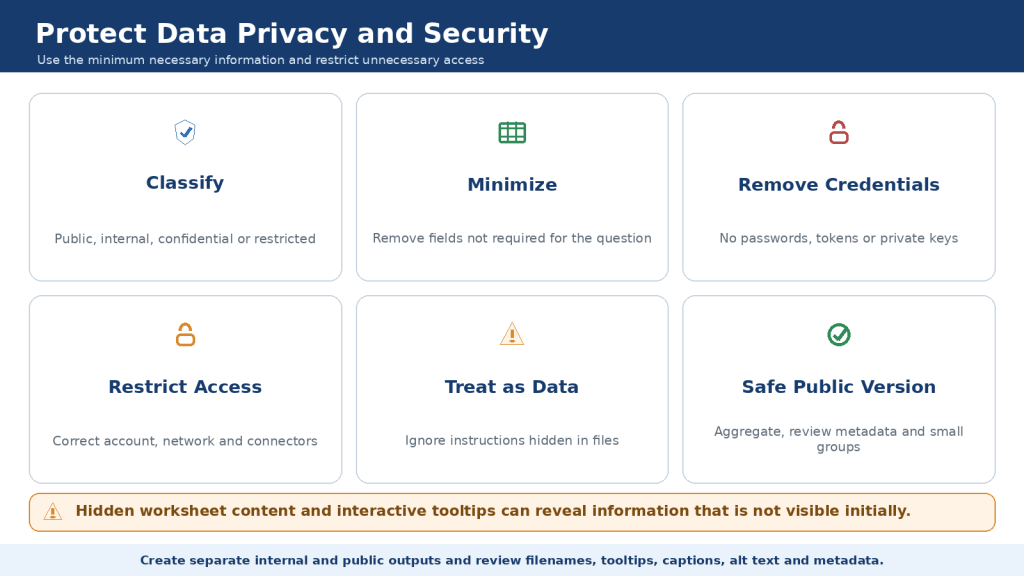
Figure 9. Protecting data during Claude analysis requires classification, permission, data minimization, credential removal, restricted access, untrusted-content controls, safe exports, and separate internal and public versions.
Review hidden content, small groups, network access, connectors, metadata, labels, tooltips, and sharing scope.
Practical Workflows for Beginners
Start with a fictional table that contains four to six rows. Verify a total, average, percentage change, and one chart manually. Then progress to one CSV, one workbook, carefully joined files, interactive exploration, and a fixed publication package.
For recurring monthly analysis, document the required columns, validation rules, cleaning rules, formulas, chart specifications, output filenames, verification tests, privacy review, and approval roles. Test the procedure before relying on it.
Workflow 1: Small pasted table
Confirm every value, calculate simple summaries, verify manually, and create one line or bar chart.
Workflow 2: One CSV file
Inspect the structure, approve category and missing-value rules, calculate a grouped summary, and export one PNG.
Workflow 3: Excel workbook
Preserve Original Data, create Cleaned Data, Analysis Summary, Chart Data, Charts, Validation Checks, and Notes sheets.
Workflow 4: Several files
Inspect each source separately, confirm matching keys, approve a join plan, and reconcile rows and totals after every join.
Workflow 5: WordPress package
Create a fixed 1600 x 900 PNG, alt text, title, caption, description, explanation, source note, and verification record.

Figure 10. Practical Claude data workflows progress from a small pasted table and one-file analysis to reviewed workbooks, carefully joined datasets, interactive exploration, fixed publication files, and repeatable approved procedures.
Increase complexity gradually and verify one source, calculation, chart, and exported file before adding more.
How to Troubleshoot Common Problems
Identify the failed stage before attempting a correction. Preserve the last correct source and output, record the exact error, reduce the task to the smallest reproducible example, apply one focused fix, and recheck every downstream calculation and file.
Upload problems can involve account settings, unsupported formats, file size, corruption, connection issues, or administrator controls. Reading problems often involve the wrong worksheet, blank formatted rows, merged cells, ambiguous dates, vague headings, or numbers stored as text.
Calculation problems usually require showing every included value, excluded value, filter, formula, denominator, missing-value rule, and unrounded result. Chart problems require checking the source range, observation count, order, axis scale, labels, and exported dimensions. File problems require opening the actual output rather than trusting the download link.
| Problem | Focused response |
| XLSX cannot upload | Confirm code execution, file validity, account controls, and a fresh XLSX or CSV copy |
| Wrong total | Show included values, exclusions, filters, formula, and missing-value treatment |
| Months out of order | Sort by a real date field rather than month text or value |
| PNG blurry or wrong size | Request a direct 1600 x 900 export and inspect the actual properties |
| Workbook repair warning | Preserve the failed file, review the repair log, rebuild a simpler workbook, and retest |
| Conversation too long | Preserve approved outputs and move the exact source, rules, results, and chart specification into a focused new chat |

Figure 11. Troubleshooting Claude data analysis works best when you preserve the last correct output, isolate the failed stage, test the smallest possible example, apply one focused correction, and recheck every affected result and file.
Upload, calculation, chart, export, usage, and context problems require different solutions.
Common Mistakes and How to Avoid Them
Vague request
Reality: “Analyze everything” gives Claude too much freedom to choose questions, rules, and outputs.
How to Avoid This Mistake: Define one decision, period, unit, dataset, calculation set, and output.
Wrong source or version
Reality: A plausible analysis can be built from an old workbook or the wrong sheet.
How to Avoid This Mistake: Record the approved filename, worksheet, date range, row count, and status before analysis.
Blank values treated as zero
Reality: Missing, unknown, not applicable, pending, and zero are different states.
How to Avoid This Mistake: Approve a missing-value rule for every affected field.
Duplicates or outliers removed automatically
Reality: Similar or unusual records can represent valid refunds, corrections, campaigns, or rare events.
How to Avoid This Mistake: Preserve the records, compare the effect, and require source-owner approval.
Wrong denominator or average
Reality: Many percentage and average errors look plausible.
How to Avoid This Mistake: Show numerator, denominator, weighting, included observations, and manual check.
Misleading chart
Reality: Wrong type, order, baseline, scale, or hidden missing periods can distort the message.
How to Avoid This Mistake: Approve a chart specification and compare the final visual with its source table.
Preview trusted as final
Reality: PNG, XLSX, DOCX, PDF, and presentation exports can differ from the conversation preview.
How to Avoid This Mistake: Download and open every format separately.
Package marked complete too early
Reality: A planned filename or intended deliverable is not a completed file.
How to Avoid This Mistake: Mark a file complete only after it exists, opens, contains the required content, and passes review.
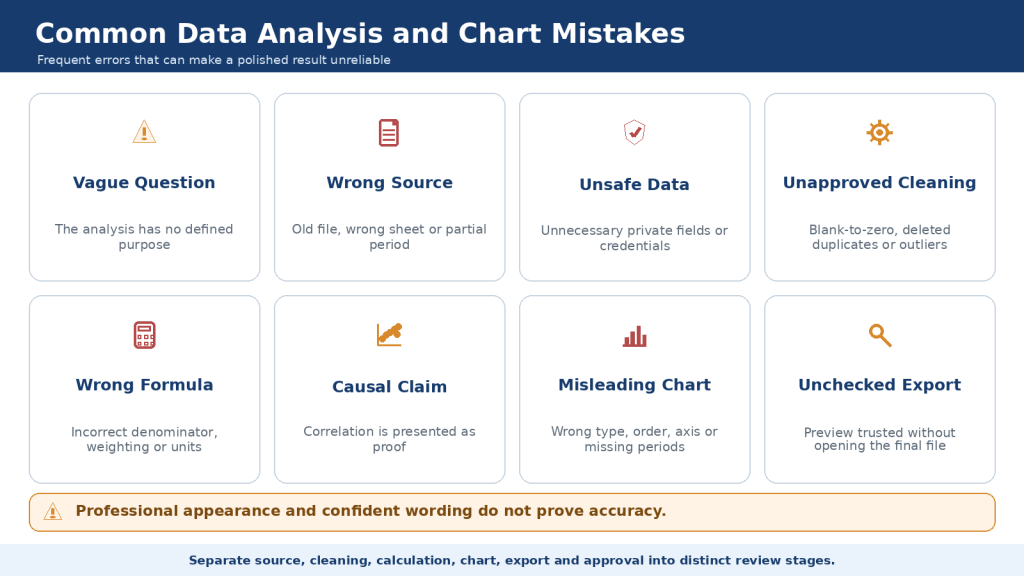
Figure 12. Common Claude data-analysis mistakes include vague questions, wrong source files, unsafe data handling, unapproved cleaning, incorrect formulas, misleading chart choices, unchecked exports, and declaring files complete before verification.
Separate inspection, cleaning, calculation, charting, export, and approval into distinct stages.
Frequently Asked Questions
Can Claude analyze spreadsheet data?
Yes. With the appropriate capability enabled, Claude can inspect structured data, run calculations, create charts, and produce files. The user must verify the work.
Do I need to know Python?
No. You can describe the task in ordinary language, but asking for a plain-language explanation and preserved analysis logic improves traceability.
Which files can be uploaded?
Current official guidance lists common formats including CSV, JSON, XLSX, PDF, DOCX, TXT, HTML, ODT, RTF, and EPUB. XLSX upload requires code execution and file creation.
Can Claude create interactive charts?
Yes, custom visuals can be requested in supported web and desktop chats. They are beta, temporary by default, and require a static alternative for dependable publication and mobile access.
Can Claude create an Excel workbook with formulas?
Yes. Open the workbook in the intended spreadsheet application and inspect formula cells, references, date and currency formats, chart ranges, and errors.
Should a pie chart be used for survey results?
Only when the answers are mutually exclusive and form one meaningful total. Multiple-response questions normally require a bar chart.
How should I verify a chart?
Use a plain chart-data table, count the observations, compare every value, check order and axes, review missing and partial periods, and inspect the exported file.
Can I upload confidential data?
Use only authorized minimum necessary information in the correct account and workspace. Do not upload credentials or restricted records, and obtain privacy or legal review where required.
Can Claude replace a data analyst?
Claude can reduce technical work, but high-impact financial, medical, scientific, legal, employment, government, or safety analysis requires the appropriate qualified reviewer.
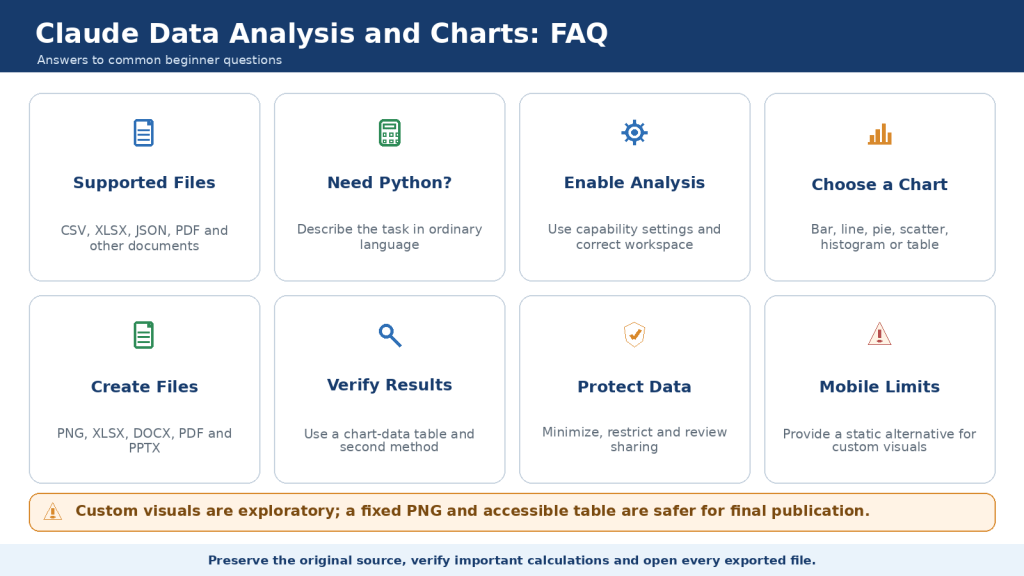
Figure 13. Common questions about Claude data analysis cover supported files, code execution, chart selection, interactive and downloadable outputs, verification, privacy, usage limits, and final human approval.
Preserve the original source, verify important calculations, compare charts with data tables, and open each exported file.
Complete Step-by-Step Claude Data Analysis Workflow
The following end-to-end procedure brings the earlier guidance into one controlled workflow. It is suitable for a small business report, website-performance review, survey summary, or educational project. Adjust the details to match the source owner’s approved rules.
Work through the stages in order. Do not move directly from upload to a final chart. Each stage creates evidence needed to review the next one.
Stage 1: Define the purpose
Write one sentence explaining the decision or question. Identify the intended reader, date range, unit, currency, and required output. State what is outside the scope. For example: “Use the approved January-June 2026 website dataset to compare visitors by article category and create one verified horizontal bar chart for a WordPress article.”
Define success before analysis. A useful result should answer the approved question, reconcile with the source, explain limitations, and be understandable to a beginner.
Stage 2: Prepare the working copy
Preserve the original file as read-only. Create a working copy with a versioned filename. Remove worksheets, columns, comments, credentials, and personal details that are not required. Document anything removed.
Create or attach a data dictionary. For every field, record its approved meaning, type, unit, allowed values, missing-value rule, and whether it can identify a person.
Stage 3: Inspect without changing
Ask Claude to list files, worksheets, table boundaries, row counts, column counts, headings, data types, date formats, date range, units, currencies, missing values, duplicate candidates, formulas, hidden content, external links, and possible privacy risks.
Compare the inspection report with the original file. Correct Claude when it interprets a heading incorrectly. Do not allow a plausible guess to become an undocumented business rule.
Stage 4: Approve cleaning rules
Separate formatting corrections from judgment decisions. Trimming spaces, normalizing clearly equivalent capitalization, and converting an unambiguous number stored as text are usually lower risk. Deleting rows, replacing missing values, merging categories, converting currency, excluding periods, or changing suspected errors are higher risk.
Require a cleaning-plan table with issue, affected rows, proposed action, reason, effect on results, risk level, and approval status. Approve the plan before Claude produces a cleaned file.
Stage 5: Create traceable cleaned data
Create Original Data, Cleaned Data, Cleaning Log, Validation Checks, and Notes worksheets. Preserve a stable source-row identifier. Every changed value should have an original value, cleaned value, rule, reason, reviewer, and status.
Keep unresolved items visible. A value can remain Pending Review or Excluded from Analysis rather than being guessed.
Stage 6: Reconcile the cleaned file
Recalculate row counts, missing-value counts, duplicate counts, category frequencies, date range, minimums, maximums, and important totals. Compare the profile before and after cleaning.
Any changed financial, visitor, subscriber, or transaction total must be explained by the cleaning log. Review a sample of changed rows and several unchanged rows.
Stage 7: Lock the analysis source
Record the approved filename, worksheet, row count, date range, unit, currency, and cleaning approval. Tell Claude to use only the approved Cleaned Data worksheet and not to make further changes without permission.
When several files are required, inspect each one independently. Approve the matching field, expected relationship, join type, duplicate keys, unmatched records, and expected row count before joining.
Stage 8: Calculate approved measures
Request only the calculations needed for the defined question. For each result, require the formula, columns, filters, included and excluded rows, missing-value rule, date range, unit, unrounded result, display value, and verification status.
Use totals for accumulated quantities, counts for records, averages for balanced numerical values, medians for skewed distributions, rates for an outcome divided by a relevant base, and percentage change for relative movement from an earlier non-zero value.
Stage 9: Verify independently
Check several results manually. Recalculate high-impact values in a separate spreadsheet, calculator, or reviewed script. Verify that grouped totals add back to the overall total and that a chart-data table contains exactly the values intended for plotting.
When a result differs, do not edit only the final paragraph. Identify every affected summary, chart, workbook, report, caption, and recommendation.
Stage 10: Approve a chart specification
Write the chart question, type, source table, title, axes, units, order, baseline, missing-data treatment, partial-period treatment, forecast treatment, labels, legend, rounding, accessibility plan, source note, filename, dimensions, and output format.
Ask Claude to recommend alternatives only when the appropriate chart is uncertain. Approve one specification before visual generation.
Stage 11: Create and review one output
Generate one interactive visual, PNG, workbook chart, or report chart. Compare each visible value with the chart-data table. Count bars, points, slices, lines, or bins. Check order, scale, title, units, labels, legend, annotations, missing periods, and partial periods.
For a 1600 x 900 WordPress PNG, inspect the actual image dimensions, safe margins, sharpness, mobile readability, alt text, caption, explanation, and metadata.
Stage 12: Review exported files
Open the XLSX in the intended spreadsheet application and check formulas, source ranges, date and currency formats, chart updating, hidden content, external links, and error cells. Open DOCX reports in TextMaker and review every page, table, figure, caption, hyperlink, bullet, and page break.
Inspect PDF and presentation outputs separately. A correct chat preview does not prove that the exported file is complete.
Stage 13: Complete privacy and publication review
Confirm that public files contain only approved aggregated values. Review small groups, unusual points, labels, tooltips, downloadable data, filenames, image metadata, document properties, alt text, descriptions, and source notes.
Preview the WordPress article on desktop, tablet, and mobile. Verify the permalink, category, tags, excerpt, internal links, external links, featured image, captions, and explanations.
Stage 14: Record approval and preserve the package
Record the reviewer, date, status, and notes for source data, calculations, charts, accessibility, privacy, security, and publication. Mark the work Completed only after every required file exists, opens, contains the correct material, and passes the integrity tests.
Preserve the original source, approved cleaned data, cleaning log, analysis summary, chart-data tables, scripts when applicable, final images, workbooks, reports, and approval record using versioned filenames.
Detailed Calculation Examples
Use small examples to confirm that Claude and the reviewer interpret each measure the same way. Preserve greater precision during calculation and round only for display.
Total and average
For monthly visitors of 1,200, 1,450, 1,780, and 1,690, the total is 6,120. The average is 6,120 divided by four, or 1,530. If one month is blank because data was not collected, do not automatically replace it with zero; the approved missing-value rule determines the denominator.
Median and outlier influence
For values 10, 12, 14, 16, and 100, the average is 30.4 while the median is 14. The high value strongly affects the average. This does not make 100 invalid; it means the median may better describe a typical observation.
Percentage share
If mobile visitors are 4,000 and total visitors are 10,000, mobile share is 4,000 divided by 10,000, multiplied by 100, or 40%. This formula is appropriate only when the categories are mutually exclusive parts of the same total.
Percentage change and percentage points
If visitors increase from 1,200 to 1,800, percentage change is (1,800 – 1,200) divided by 1,200, multiplied by 100, or 50%. If a conversion rate increases from 10% to 15%, it rises by five percentage points and by 50% relative to the starting rate.
Rate and denominator
If 50 people subscribe from 2,000 visitors, the conversion rate is 50 divided by 2,000, multiplied by 100, or 2.5%. Confirm that subscribers and visitors cover the same period and population.
Actual versus target
If actual revenue is CAD 140 and the target is CAD 160, the variance is CAD -20. Percentage variance is -20 divided by 160, multiplied by 100, or -12.5%. Whether this is favourable depends on the metric and approved business rule.
Correlation
A positive correlation coefficient indicates that two numerical variables tended to move together in the analyzed observations. It does not prove that one variable caused the other. Report the paired period, sample size, outliers, coefficient, and important alternative explanations.
Final Data and Chart Review Checklist
Source and cleaning
Confirm the correct account, file, version, worksheet, row count, column count, date range, unit, currency, permission, data dictionary, missing-value rule, duplicate rule, outlier treatment, cleaning log, and reconciled totals.
Calculations
Confirm formula, numerator, denominator, included rows, excluded rows, filters, grouping, weighting, rounding, partial periods, observed versus estimated status, and independent verification.
Chart
Confirm the question, approved source table, chart type, observation count, every plotted value, category or date order, title, axes, units, baseline, scale, labels, legend, missing data, forecasts, accessibility, alt text, caption, explanation, and source note.
Exported files
Confirm that each file exists, has a non-zero size, opens without repair, contains the expected worksheets or pages, preserves formulas where required, uses the correct image dimensions, contains no clipped content, and matches the approved analysis.
Privacy and security
Confirm that credentials and unnecessary personal data are absent, hidden content and metadata are reviewed, network and connectors are limited, embedded instructions are ignored, public and internal versions are separate, small groups are protected, and the sharing audience is approved.
Publication
Confirm the WordPress title, reading time, Last Updated line, category, tags, slug, SEO title, meta description, excerpt, featured image, alt text, figure order, captions, explanations, internal links, official sources, desktop preview, tablet preview, mobile preview, and final human sign-off.
Key Takeaways
Claude can reduce the technical difficulty of inspecting data, calculating summaries, creating charts, and producing files. Reliability still comes from controlled inputs, documented rules, transparent calculations, truthful visuals, separate file review, privacy protection, and responsible human judgment.
Use the safest complete workflow: preserve the original source; confirm permission; minimize sensitive information; inspect without changing; clarify headings, dates, units, and business rules; approve a cleaning plan; create a traceable working copy; reconcile totals; define one question; show formulas; verify important results independently; approve a chart specification; create one output at a time; open every export; review privacy and accessibility; and record human approval.
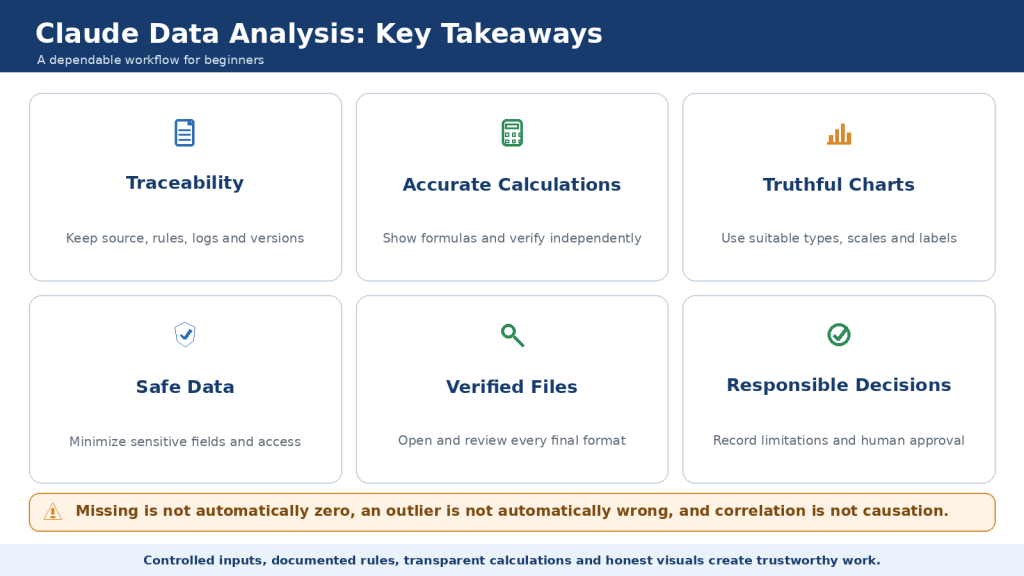
Figure 14. Safe Claude data analysis preserves the source, minimizes sensitive information, documents cleaning and calculations, chooses truthful charts, verifies every export, and requires final human approval.
Keep every stage traceable and mark outputs Draft until all reviews are complete.
Conclusion
The strongest analysis is not the one with the most calculations, the most colourful dashboard, or the most advanced model. It is the analysis that answers the correct question, uses an approved and traceable source, applies documented rules, shows transparent calculations, uses an honest and accessible chart, protects private information, opens correctly in its final format, states limitations clearly, and can be reproduced.
Begin with a tiny fictional dataset and verify every value manually. Increase complexity only after the simple workflow has passed. Claude should assist with the technical process rather than control the meaning of the data or the final decision.
Continue Learning
Practice with a fictional six-month website-performance table. Ask Claude to inspect it, calculate total visitors, average visitors, total subscribers, average revenue, highest and lowest months, and percentage change from January to June. Verify the expected values independently before approving a line chart.
Continue with:
- Article 048 to organize recurring datasets and instructions in Claude Projects,
- Article 049 to turn approved work into an Artifact,
- Article 050 to research current public benchmarks or official evidence separately from the uploaded dataset.
- Level 1: pasted fictional table.
- Level 2: one approved CSV file.
- Level 3: one Excel workbook with formulas and charts.
- Level 4: several carefully joined files.
- Level 5: interactive exploration with a fixed final alternative.
- Level 6: WordPress-ready publication package.
- Level 7: a tested and approved repeatable procedure.
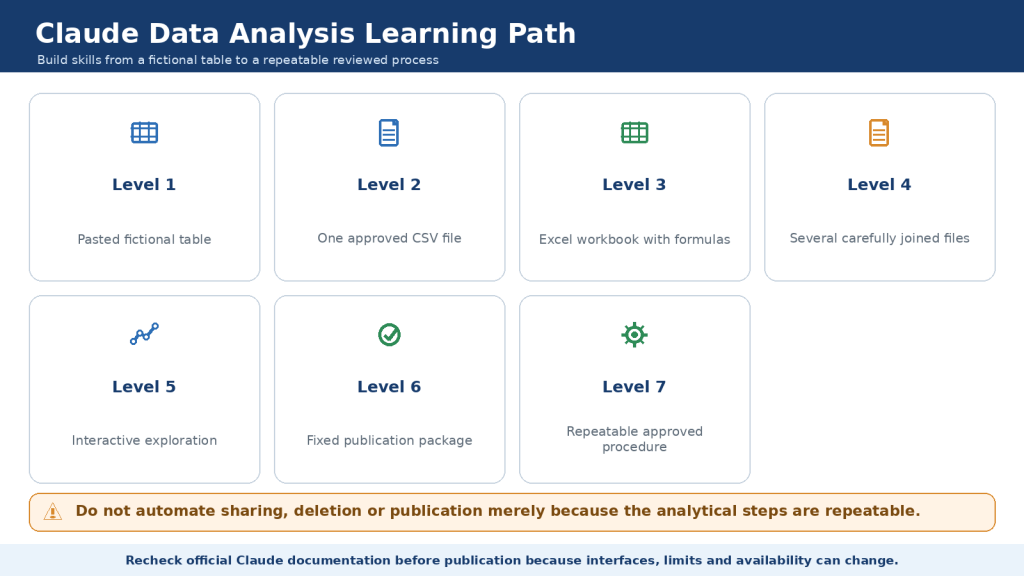
Figure 15. A safe Claude data-analysis learning path progresses from a small fictional table to verified spreadsheets, carefully joined files, interactive exploration, fixed publication packages, and repeatable human-approved procedures.
Build one skill at a time and recheck official documentation before publication because availability and interfaces can change.
Sources and References
Sources reviewed: August 5, 2026
1. Create and Edit Files with Claude
3. Custom Visuals in Chat and Cowork
4. How Do Usage and Length Limits Work?
5. Troubleshoot Claude Error Messages
6. Claude Is Providing Incorrect or Misleading Responses – What Is Going On?
7. I Would Like to Input Sensitive Data into My Chats with Claude. Who Can View My Conversations?
8. Does Anthropic Act as a Data Processor or Controller?
9. Who Owns and Manages the Data of My Team?
10. Publish and Share Artifacts


Leave a comment